Download

1 / 11
110 likes | 221 Views
The Normal Model. Ch. 6. Approximating with the Normal model. Nearly Normal Condition The shape of the data’s distribution is roughly unimodal and symmetric. Check this by making a histogram (or Normal probability plot) YOU MUST CHECK THE NEARLY NORMAL CONDITION !!!.

E N D
The Normal Model Ch. 6
Approximating with the Normal model Nearly Normal Condition • The shape of the data’s distribution is roughly unimodal and symmetric. • Check this by making a histogram (or Normal probability plot) • YOU MUST CHECK THE NEARLY NORMAL CONDITION!!!
“All models are wrong – but some are useful.” -- George Box
Statistics vs. Parameters Statistics Parameters Values that specify the model -- mean -- standard deviation N(, )—Normal model with mean and standard deviation • Summaries of actual data
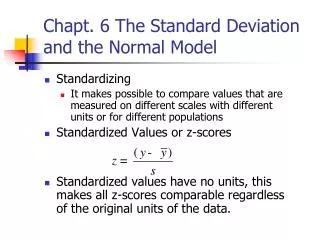
Rescale the Data • Standardize the data so that the: • average is 0 • standard deviation is 1 • Convert the data to z-scores • Each value is converted to a Standard Score (z-score)
The Normal Model - 1 - 2 - 3 + 1 + 2 + 3
The 68-95-99.7 Rulea.k.a. The Empirical Rule 68% 95% 99.7% - 1 - 2 - 3 + 1 + 2 + 3
The Setup The distribution of fuel efficiency of a particular vehicle is roughly unimodal and symmetric with mean 24 mpg and standard deviation 6 mpg.
Check the Nearly Normal Condition • Sketch the Normal model • What percent of all cars get less than 15 mpg? • Describe the fuel efficiency of the worst 20% of all cars. • What percent of all cars get between 20 mpg and 30 mpg? • What percent of cars get more than 40 mpg? • What gas mileage represents the third quartile? • Describe the gas mileage of the most efficient 5% of all cars.