Download
1 / 1
20 likes | 148 Views
Data + Smoothed polynomial. AFA plot. Adaptive fractal analysis of postural sway. w. log 2 w. Nikita Kuznetsov 1 , Michael Riley 1 , Scott Bonnette 1, & Jianbo Gao 2 , Illya Vilinsky 3 1 Center for Cognition, Action, & Perception, Department of Psychology, University of Cincinnati, OH

E N D
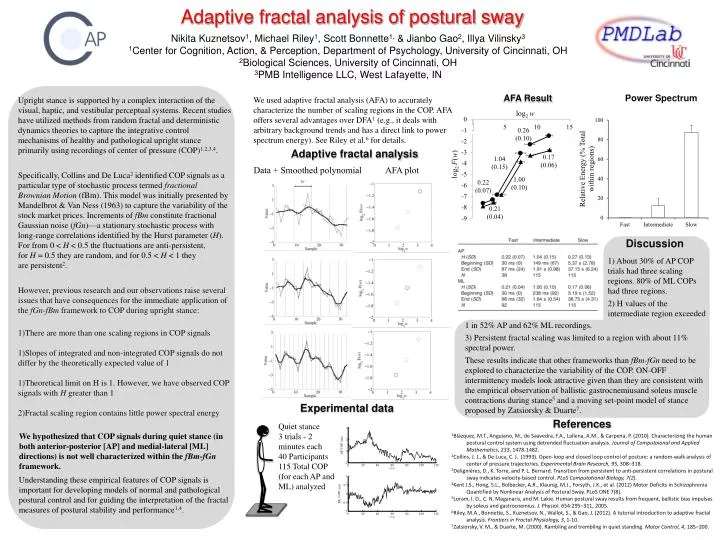
Data + Smoothed polynomial AFA plot Adaptive fractal analysis of postural sway w log2 w Nikita Kuznetsov1, Michael Riley1, Scott Bonnette1, & Jianbo Gao2, Illya Vilinsky3 1Center for Cognition, Action, & Perception, Department of Psychology, University of Cincinnati, OH 2Biological Sciences, University of Cincinnati, OH 3PMB Intelligence LLC, West Lafayette, IN 0.26 (0.10) 0.17 (0.06) 1.04 (0.15) log2 F(w) Power Spectrum AFA Result We used adaptive fractal analysis (AFA) to accurately characterize the number of scaling regions in the COP. AFA offers several advantages over DFA1 (e.g., it deals with arbitrary background trends and has a direct link to power spectrum energy). See Riley et al.6 for details. • Upright stance is supported by a complex interaction of the visual, haptic, and vestibular perceptual systems. Recent studies have utilized methods from random fractal and deterministic dynamics theories to capture the integrative control mechanisms of healthy and pathological upright stance primarily using recordings of center of pressure (COP)1,2,3,4. • Specifically, Collins and De Luca2 identified COP signals as a particular type of stochastic process termed fractional Brownian Motion (fBm). This model was initially presented by Mandelbrot & Van Ness (1963) to capture the variability of the stock market prices. Increments of fBm constitute fractional Gaussian noise (fGn)—a stationary stochastic process with long-range correlations identified by the Hurst parameter (H). For from 0 < H < 0.5 the fluctuations are anti-persistent, for H = 0.5 they are random, and for 0.5 < H < 1 they are persistent2. • However, previous research and our observations raise several issues that have consequences for the immediate application of the fGn-fBm framework to COP during upright stance: • There are more than one scaling regions in COP signals • Slopes of integrated and non-integrated COP signals do not differ by the theoretically expected value of 1 • Theoretical limit on H is 1. However, we have observed COP signals with H greater than 1 • Fractal scaling region contains little power spectral energy 0.22 (0.07) Adaptive fractal analysis 0.21 (0.04) Discussion 1) About 30% of AP COP trials had three scaling regions. 80% of ML COPs had three regions. 2) H values of the intermediate region exceeded 1 in 52% AP and 62% ML recordings. 3) Persistent fractal scaling was limited to a region with about 11% spectral power. These results indicate that other frameworks than fBm-fGn need to be explored to characterize the variability of the COP. ON-OFF intermittency models look attractive given than they are consistent with the empirical observation of ballistic gastrocnemiusand soleus muscle contractions during stance5 and a moving set-point model of stance proposed by Zatsiorsky & Duarte7. Experimental data References Quiet stance 3 trials - 2 minutes each 40 Participants 115 Total COP (for each AP and ML) analyzed We hypothesized that COP signals during quiet stance (in both anterior-posterior [AP] and medial-lateral [ML] directions) is not well characterized within the fBm-fGn framework. 1Blázquez, M.T., Anguiano, M., de Saavedra, F.A., Lallena, A.M., & Carpena, P. (2010). Characterizing the human postural control system using detrended fluctuation analysis. Journal of Computaional and Applied Mathematics, 233, 1478-1482. 2Collins, J. J., & De Luca, C. J. (1993). Open-loop and closed loop control of posture: a random-walk analysis of center of pressure trajectories. Experimental Brain Research, 95, 308–318. 3Delignières, D., K. Torre, and P. L. Bernard. Transition from persistent to anti-persistent correlations in postural sway indicates velocity-based control. PLoS Computational Biology, 7(2). 4Kent J.S., Hong, S.L., Bolbecker, A.R., Klaunig, M.J., Forsyth, J.K., et al. (2012) Motor Deficits in Schizophrenia Quantified by Nonlinear Analysis of Postural Sway. PLoS ONE 7(8). 5Loram, I. D., C. N. Maganaris, and M. Lakie. Human postural sway results from frequent, ballistic bias impulses by soleus and gastrocnemius. J. Physiol. 654:295–311, 2005. 6Riley, M.A., Bonnette, S., Kuznetsov, N., Wallot, S., & Gao, J. (2012). A tutorial introduction to adaptive fractal analysis. Frontiers in Fractal Physiology, 3, 1-10. 7Zatsiorsky, V. M., & Duarte, M. (2000). Rambling and trembling in quiet standing. Motor Control, 4, 185–200. Understanding these empirical features of COP signals is important for developing models of normal and pathological postural control and for guiding the interpretation of the fractal measures of postural stability and performance1,4.