Download

1 / 29
310 likes | 603 Views
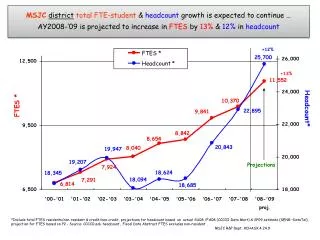
Mills College 2009 SOC128 G eographic I nformation S ystems and Sociological Geography. Projections I. The Problem. http://publib.boulder.ibm.com/infocenter/dzichelp/v2r2/topic/com.ibm.db29.doc.spatial/csb3022a.htm. The Problem. A “rectangle” on the earth’s surface…

E N D
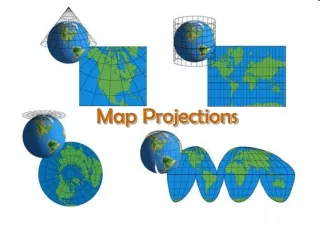
Mills College 2009SOC128GeographicInformationSystems and Sociological Geography Projections I
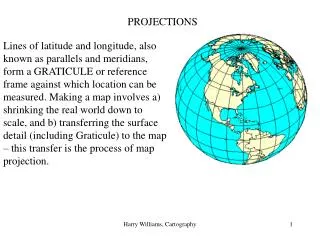
The Problem http://publib.boulder.ibm.com/infocenter/dzichelp/v2r2/topic/com.ibm.db29.doc.spatial/csb3022a.htm
The Problem • A “rectangle” on the earth’s surface… • …that is, a four cornered area aligned with parallels and meridians Cwest, Bnorth Awest, Bnorth Awest, Dnorth Cwest, Dnorth
A Puzzle • Start anywhere out on the meadow. • Face due north and walk 200 miles. • Turn right to face due east and walk 200 miles. • Turn right again to face due south and walk 200 miles. • Turn right one last time and walk due west 200 miles. • Where are you now?
Puzzle Number 2 • Take a globe. Identify two cities, say NY and London. • What direction should you set out from the one if you wish to sail/fly in a straight line and arrive at the other? • What if I have a map instead of a globe?
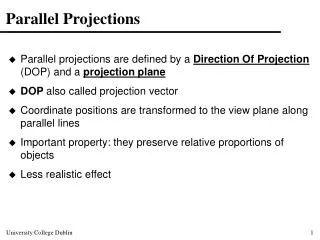
The Globe • Directions—True • Distances—True • Shapes—True • Areas—True • Great circles—The shortest distance between any two points on the surface of the Earth can be found quickly and easily along a great circle. • Disadvantages: • Even the largest globe has a very small scale and shows relatively little detail. • Costly to reproduce and update. • Difficult to carry around. • Bulky to store. • On the globe: • Parallels are parallel and spaced equally on meridians. Meridians and other arcs of great circles are straight lines (if looked at perpendicularly to the Earth's surface). Meridians converge toward the poles and diverge toward the Equator. • Meridians are equally spaced on the parallels, but their distances apart decreases from the Equator to the poles. At the Equator, meridians are spaced the same as parallels. Meridians at 60° are half as far apart as parallels. Parallels and meridians cross at right angles. The area of the surface bounded by any two parallels and any two meridians (a given distance apart) is the same anywhere between the same two parallels. • The scale factor at each point is the same in any direction.
Mercator • Used for navigation or maps of equatorial regions. Any straight line on the map is arhumb line (line of constant direction). Directions along a rhumb line are true between any two points on map, but a rhumb line is usually not the shortest distance between points. (Sometimes used with Gnomonic map on which any straight line is on a great circle and shows shortest path between two points). • Distances are true only along Equator, but are reasonably correct within 15° of Equator; special scales can be used to measure distances along other parallels. Two particular parallels can be made correct in scale instead of the Equator. • Areas and shapes of large areas are distorted. Distortion increases away from Equator and is extreme in polar regions. Map, however, is conformal in that angles and shapes within any small area (such as that shown by USGS topographic map) is essentially true. • The map is not perspective, equal area, or equidistant. • Equator and other parallels are straight lines (spacing increases toward poles) and meet meridians (equally spaced straight lines) at right angles. Poles are not shown. • Presented by Mercator in 1569. • Cylindrical— Mathematically projected on a cylinder tangent to the Equator. (Cylinder may also be secant.)
Mercator Stefan Kühnhttp://commons.wikimedia.org/wiki/File:Tissot_mercator.png http://commons.wikimedia.org/wiki/File:Mercator_projection_SW.jpg
Transverse Mercator • Used by USGS for many quadrangle maps at scales from 1:24,000 to 1:250,000; such maps can be joined at their edges only if they are in the same zone with one central meridian. Also used for mapping large areas that are mainly north–south in extent. • Distances are true only along the central meridian selected by the mapmaker or else along two lines parallel to it, but all distances, directions, shapes, and areas are reasonably accurate within 15° of the central meridian. Distortion of distances, directions, and size of areas increases rapidly outside the 15° band. Because the map is conformal, however, shapes and angles within any small area (such as that shown by a USGS topographic map) are essentially true. • Graticule spacing increases away from central meridian. Equator is straight. Other parallels are complex curves concave toward nearest pole. • Central meridian and each meridian 90° from it are straight. Other meridians are complex curves concave toward central meridian. • Presented by Lambert in 1772. • Cylindrical—Mathematically projected on cylinder tangent to a meridian. (Cylinder may also be secant.)
Miller Cylindrical • Used to represent the entire Earth in a rectangular frame. Popular for world maps. Looks like Mercator but is not useful for navigation. Shows poles as straight lines. • Avoids some of the scale exaggerations of the Mercator but shows neither shapes nor areas without distortion. • Directions are true only along the Equator. Distances are true only along the Equator. Distortion of distances, areas, and shapes is extreme in high latitudes. • Map is not equal area, equidistant, conformal or perspective. • Presented by O. M. Miller in 1942. • Cylindrical—Mathematically projected onto a cylinder tangent at the Equator.
Albers Equal Area Conic • Used by USGS for maps showing the conterminous United States (48 states) or large areas of the United States. Well suited for large countries or other areas that are mainly east-west in extent and that require equal-area representation. Used for many thematic maps. • Maps showing adjacent areas can be joined at their edges only if they have the same standard parallels (parallels of no distortion) and the same scale. • All areas on the map are proportional to the same areas on the Earth. Directions are reasonably accurate in limited regions. Distances are true on both standard parallels. Maximum scale error is 1 ¼% on map of conterminous States with standard parallels of 29 ½°N and 45 ½°N. Scale true only along standard parallels. • USGS maps of the conterminous 48 States, if based on this projection have standard parallels 29 ½°N and 45 ½°N. Such maps of Alaska use standard parallels 55°N and 65°N, and maps of Hawaii use standard parallels 8°N and 18°N. • Map is not conformal, perspective, or equidistant. • Presented by H. C. Albers in 1805. • Conic—Mathematically projected on a cone conceptually secant at two standard parallels
Lambert Conformal Conic • Used by USGS for many 7.5- and 15-minute topographic maps and for the State Base Map series. Also used to show a country or region that is mainly east-west in extent. • One of the most widely used map projections in the United States today. Looks like the Albers Equal Area Conic, but graticulespacings differ. • Retains conformality. Distances true only along standard parallels; reasonably accurate elsewhere in limited regions. Directions reasonably accurate. Distortion of shapes and areas minimal at, but increases away from standard parallels. Shapes on large-scale maps of small areas essentially true. • Map is conformal but not perspective, equal area, or equidistant. • For USGS Base Map series for the 48 conterminous States, standard parallels are 33°N and 45°N (maximum scale error for map of 48 States is 2 ½%). For USGS Topographic Map series (7.5- and 15-minute), standard parallels vary. For aeronautical charts of Alaska, they are 55°N and 65°N; for the National Atlas of Canada, they are 49°N and 77°N. • Presented by Lambert in 1772. • Conic—Mathematically projected on a cone conceptually secant at two standard parallels.
Peters Projection Indicatrix Eric Gaba (http://commons.wikimedia.org/wiki/File:Tissot_indicatrix_world_map_Gall-Peters_equal-area_proj.svg)
Peters Projection • Claimed in 60s to be “all new,” only equal area, better than dominant Mercator, equi-everything • In fact, not new and doesn’t really solve all the problems of distortion and lots of options were (are) out there. • Peters’ campaign and “unscholarly” activity motivated a renewed attempt to educate public about projections • So, he does get credit for raising awareness of political implications of projections.
Mollweide http://commons.wikimedia.org/wiki/File:Mollweide_projection_SW.jpg
MollweideEqual Area Projection • Sacrifices fidelity to angle and shape in favor of accurate depiction of area. Eric Gaba (http://commons.wikimedia.org/wiki/File:Tissot_indicatrix_world_map_Mollweide_proj.svg)
Eckert IV http://commons.wikimedia.org/wiki/File:Ecker_IV_projection_SW.jpg
Eckert VI http://commons.wikimedia.org/wiki/File:Ecker_VI_projection_SW.jpg
Azimuthal Projection http://commons.wikimedia.org/wiki/File:Usgs_map_azimuthal_equidistant.PNG http://www.mathworks.com/help/toolbox/map/projec3a.gif
Credits • http://egsc.usgs.gov/isb/pubs/MapProjections/projections.html • Wikipedia