Download
1 / 28
280 likes | 563 Views
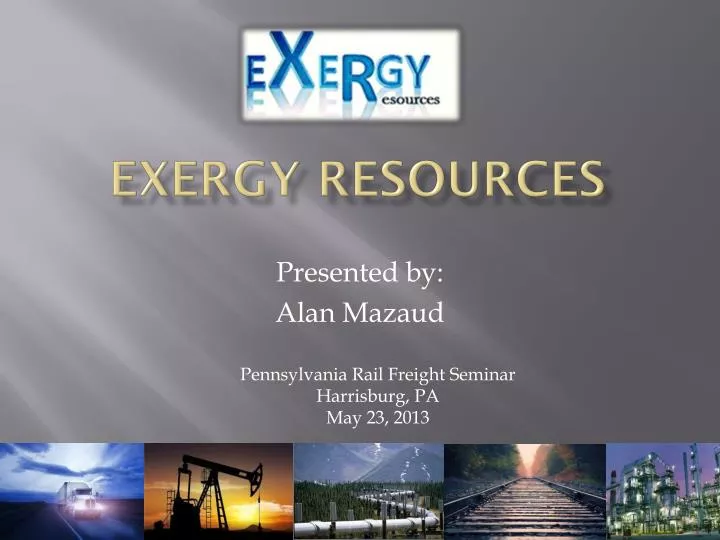
Exergy Resources. Presented by: Alan Mazaud. Pennsylvania Rail Freight Seminar Harrisburg, PA May 23, 2013. Summary. Firm background and activity US crude oil production status A reas of shale activity Bakken rail opportunity

E N D
Exergy Resources Presented by: Alan Mazaud Pennsylvania Rail Freight Seminar Harrisburg, PA May 23, 2013
Summary • Firm background and activity • US crude oil production status • Areas of shale activity • Bakken rail opportunity • WTI/Brent spread and its effect on crude by rail business model • Key takeaways
Exergy Resources • A crude marketing firm based in New York City with an office in North Dakota • Firm originated from private equity and became independent in 2012 • Backed by private equity and family offices • Will purchase for its own book and take title as well as on behalf of third parties • Focus on Bakken, Canada, USGC • Transport via pipeline, rail and truck
Importance of crude as a U.S. energy source Shares of total U.S. energy 2011 Projections History 2000 28% Natural gas 24% 26% 6% 8% 11% Renewables (excluding liquid biofuels) 8% 8% Nuclear 9% 2% 1% 23% Liquid biofuels 20% 19% Coal 39% 32% Oil and other liquids 36% Source: EIA, Annual Energy Outlook 2013 Early Release
U.S. petroleum product exports exceeded imports in 2011 for first time in over six decades net product exporter Source: EIA, Petroleum Supply Monthly
U.S. tight oil production leads a growth in domestic production of 2.6 million barrels per day between 2008 and 2019 2011 History Projections STEO Feb. 2013 U.S. crude oil projection Alaska Source: EIA, Annual Energy Outlook 2013 Early Release and Short-Term Energy Outlook, February 2013
Global tight oil production comparisons Source: Preliminary International Energy Outlook 2013, BP Energy Outlook 2030
Growth of Domestic Production of Tight Oil Source: Drilling Info (formerly HPDI), Texas RRC, North Dakota department of mineral resources, and EIA, through October 2012.
Texas Shale Plays • Permian Basin (Bonespring, Spraberry) has production of 1.3MM b/d as of Q1 2013 • Projections for 2016 are 1.9MM b/d • Pipeline projects for Permian basin to USGC • By mid 2014 1.365MM b/d of capacity • Eagle Ford • Current production at 700M – 800M b/d • Est for future production: 1.6MM b/d by end of 2016 • Total capacity of pipeline projects outpaces expected production by around 200M-400M b/d • The success of these shale plays could force Bakken crude to move solely to the east and west coasts Source: Platts, Turner Mason
Utica • ODNR released report last month on 2012 production • 87 wells • 1,750 b/d of oil • 35 MM cf/d of gas • Considered disappointing • To date, 660 shale well permits, 326 have been drilled and only 97 in production • Producers waiting on infrastructure (takeaway and processing capacity) Source: Halcon Resources Presentation, RBN Energy
Bakken • Current production estimates are 800M b/d range • 2013 U.S. Geological Survey estimates undiscovered volumes of 7.4 Bn barrels of oil vs 3.65 Bn barrels from 2008 survey • Beware the decline curve • Current Rail takeaway capacity is at 730M b/d taken from 22 terminals • Only 72,000 b/d went to US East coast in Dec ‘12 • Will grow to 175k-235k at end of 2013 • 64% of crude traveled via rail, 27% via pipeline Source: Platts, Turner Mason, Bentek, North Dakota Pipeline Authority
Bakken • Rail deals on East Coast: • P66 announced a 5 yr contract to move 50M bpd crude by rail to Bayway, NJ facility (CSX/NS) • PBF Energy in Delaware City can handle 40M b/d of heavy and 70M b/d of light via rail (NS) Source: Platts, Turner Mason, Bentek
Path of a Bakken Rail Barrel • Wellhead to Terminal Gathering System • Will be a trucking or pipeline gathering fee • $2-$3 • Facility fee for rail • $1.50-$2 • Rail Freightand Fuel Surcharge • Tank car lease • ~$3,000/mo/car • Crude shrinkage cost – can run .5%-3% loss factor
Where does the East Coast rail option rank? Source: RBN Energy
WTI/Brent – Historical Pricing Source: RBN Energy
Decrease of Brent/WTI Spread Source: CME data from Morningstar
The threat on Bakken Pricing • Bakken producers’ netback directly affected by spread compared to cost of transportation • Pricing will depend on the availability of a pipeline alternative • Bakken production will first look to move to the Gulf via pipeline • Increase in production vs increase in pipeline capacity Source: RBN Energy, EIA
Its about Cushing Volumes • Bakken and other shale crudes have nowhere else to go • Bottleneck and glut leads to decline in price • Prior to the Seaway reversal, Exxon’s Pegasus pipeline was the only route to clear the Midwest • As more pipelines come online, bottleneck is removed, increasing demand for this crude
Its not about Cushing Volumes • Movements in spread haven’t matched changes at Cushing • Other influences of crude price: • Midwest refinery demand • Production from Texas • Will Seaway ship light or heavy crude • Glut in the Gulf • Exports??? Source: CME data, RBE
Cushing Inventory Barrel Total at Cushing Source: EIA
Key Takeaways • In the short term difficult to say how the spreads will look • Longer term, price spreads will match cost of transportation to market • Production will need to • Watch production growth, decline curves as production will need to match or exceed growth in pipeline capacity • If spreads remain low, inland crudes that are more reliant on rail to get to market will increasingly trade at a discount to WTI • At start of May Bakken crude was $1 below WTI, mid May -$4 • Aside from pricing, relationships and customer service are key!
For Further Information or Questions, Please Contact: Alan Mazaud Exergy Resources LLC Phone: (212) 686-0073 Email: alanm@exrllc.com