Download
1 / 65
650 likes | 727 Views
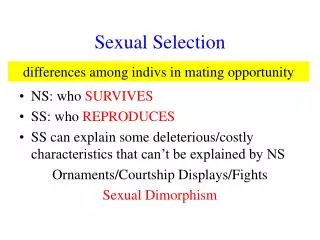
Sexual Selection II. The use of models. Preliminary points. My lecture presentations appear in PowerPoint and PDF formats at http://users.ox.ac.uk/~grafen/lectpres/ A general reading list appears shortly on a slide (which is therefore online - see above). General References.

E N D
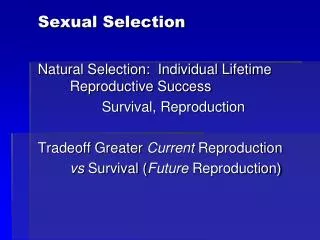
Sexual Selection II The use of models
Preliminary points • My lecture presentations appear in PowerPoint and PDF formats at http://users.ox.ac.uk/~grafen/lectpres/ • A general reading list appears shortly on a slide (which is therefore online - see above)
General References • C. Darwin (1871) The Descent of Man and Selection in Relation to Sex. Republished in 1981 by Princeton University Press. (Extracts in M.Ridley (1987) The Essential Darwin. Unwin Hyman.) • Andersson, M (1994) Sexual Selection. Princeton University Press • Dawkins, MS (1995) Unravelling Animal Behaviour, 2nd edn. Chapter 6. • Krebs, JR & Davies, NB (1993) An introduction to Behavioural Ecology, 3rd edn. Blackwell Scientific. • Ridley, M (1996) Evolution, 2nd edn. Blackwell Science. Section 11.4. (pp 296-307)
Why do models matter? An example: • Idea: Fisher’s runaway process • Model: Lande’s model • Which bits • does the model capture? • does the model miss out? • How does the model clarify, extend, develop?
Why do models matter? An example: • Idea: Fisher’s runaway process • Model: Lande’s model • Which bits • does the model capture? • does the model miss out? • How does the model clarify, extend, develop?
This slide and the three following slides show the whole treatment of Fisher’s runaway process in the 1958 edition of Fisher’s Genetical Theory of Natural Selection. The idea was first proposed by Fisher in a paper in 1915.
and that was that. No equations, just words. An extraordinary and wonderful idea about self-reinforcement of preferences, placed within a context of other selective forces and phases of selection.
Why do models matter? An example: • Idea: Fisher’s runaway process • Model: Lande’s model • Which bits • does the model capture? • does the model miss out? • How does the model clarify, extend, develop?
Why do models matter? An example: • Idea: Fisher’s runaway process • Model: Lande’s model • Which bits • does the model capture? • does the model miss out? • How does the model clarify, extend, develop?
Before Lande’s model... • O’Donald (a former student of Fisher’s) had made various models that seemed to show the idea did not work, or worked partially and only in rather unusual circumstances • Population geneticists were reluctant to accept that a verbal argument could make sense
Relative Frequency Male Trait 0.12 0.1 0.08 0.06 0.04 0.02 10 20 30 40 Zygotes
Relative Frequency Male Trait 0.12 0.1 0.08 0.06 0.04 0.02 10 20 30 40 Zygotes, are subject to differential viability so the Survivors have a lower mean.
Relative Frequency Male Trait 0.12 0.1 0.08 0.06 0.04 0.02 10 20 30 40 Zygotes, are subject to differential viability so the Survivors have a lower mean. But females mate preferentially with higher-valued males,
Relative Frequency Male Trait 0.12 0.1 0.08 0.06 0.04 0.02 10 20 30 40 Zygotes, are subject to differential viability so the Survivors have a lower mean. But females mate preferentially with higher-valued males, so the Successful Gametes have a higher mean than survivors, but in this case, not sufficiently to offset the effect of viability
Relative Frequency Male Trait 0.12 0.1 0.08 0.06 0.04 0.02 10 20 30 40 Zygotes, are subject to differential viability so the Survivors have a lower mean. But females mate preferentially with higher-valued males, so the Successful Gametes have a higher mean than survivors, which here more than offsets the effect of viability
Relative Frequency Male Trait 0.12 0.1 0.08 0.06 0.04 0.02 10 20 30 40 Zygotes, are subject to differential viability so the Survivors have a lower mean. But females mate preferentially with higher-valued males, so the Successful Gametes have a higher mean than survivors, which here more than offsets the effect of viability (Equilibrium if the blue and red lines are the same)
Relative Frequency Male Trait But what about selection on females? 0.12 0.1 0.08 0.06 0.04 0.02 10 20 30 40 Zygotes, are subject to differential viability so the Survivors have a lower mean. But females mate preferentially with higher-valued males, so the Successful Gametes have a higher mean than survivors, which here more than offsets the effect of viability (Equilibrium if the blue and red lines are the same)
Thus an equilibrium (no change) occurs whenever • there is no selection on the male trait Selection on female preference happens only • when there is a genetic correlation between the two traits, and • there is selection on the male trait
Line of neutral equilibrium Mean preferredtrait Mean male trait
Line of neutral equilibrium Mean preferredtrait Mean male trait
Line of neutral equilibrium Mean preferredtrait Lines of motion Mean male trait
Line of neutral equilibrium Mean preferredtrait Lines of motion when genetic covariance is weak Mean male trait
Line of neutral equilibrium Mean preferredtrait Lines of motion when genetic covariance is weak Mean male trait
Line of neutral equilibrium Mean preferredtrait Lines of motion when genetic covariance is weak Mean male trait
Line of neutral equilibrium Mean preferredtrait Lines of motion when genetic covariance is weak Mean male trait
Line of neutral equilibrium Mean preferredtrait Lines of motion when genetic covariance is weak Mean male trait
Line of neutral equilibrium Mean preferredtrait Lines of motion when genetic covariance is weak Mean male trait
Line of neutral equilibrium Mean preferredtrait Lines of motion when genetic covariance is weak Mean male trait
Line of neutral equilibrium Mean preferredtrait Lines of motion when genetic covariance is weak Mean male trait Weak genetic covariance leads to a line of stable equilibria, which is a formal version of Fisher’s eventual balance between natural and sexual selection
Line of neutral equilibrium Mean preferredtrait Lines of motion with strong genetic covariance Mean male trait
Line of neutral equilibrium Mean preferredtrait Lines of motion with strong genetic covariance Mean male trait
Line of neutral equilibrium Mean preferredtrait Lines of motion with strong genetic covariance Mean male trait
Line of neutral equilibrium Mean preferredtrait Lines of motion with strong genetic covariance Mean male trait
Line of neutral equilibrium Mean preferredtrait Lines of motion with strong genetic covariance Mean male trait
Line of neutral equilibrium Mean preferredtrait Lines of motion with strong genetic covariance Mean male trait
Line of neutral equilibrium Mean preferredtrait Lines of motion with strong genetic covariance Mean male trait
Line of neutral equilibrium Mean preferredtrait Lines of motion with strong genetic covariance Mean male trait
Line of neutral equilibrium Mean preferredtrait Lines of motion with strong genetic covariance Mean male trait Strong genetic covariance leads to a line of unstable equilibria
Line of neutral equilibrium Mean preferredtrait Lines of motion with strong genetic covariance Mean male trait Strong genetic covariance leads to a line of unstable equilibria which is a formal version of Fisher’s runaway process
Line of neutral equilibrium Mean preferredtrait Lines of motion with strong genetic covariance Mean male trait Strong genetic covariance leads to a line of unstable equilibria which is a formal version of Fisher’s runaway process
Line of neutral equilibrium Mean preferredtrait Lines of motion Mean male trait To get both the runaway and the eventual stability, we need to bend the line
Line of neutral equilibrium Mean preferredtrait Lines of motion Mean male trait To get both the runaway and the eventual stability, we need to bend the line
Line of neutral equilibrium Mean preferredtrait Lines of motion Mean male trait To get both the runaway and the eventual stability, we need to bend the line
Line of neutral equilibrium Mean preferredtrait Lines of motion Mean male trait To get both the runaway and the eventual stability, we need to bend the line
Line of neutral equilibrium Mean preferredtrait Lines of motion Mean male trait To get both the runaway and the eventual stability, we need to bend the line