Download
1 / 4
40 likes | 218 Views
Don’t limit yourself to infographics and static charts. With the ZoomCharts interactive data visualization software you can bring your presentations to the next level through its speed and interactivity. Data visualization has become a big part of our everyday life because of the amount of information we have to accumulate and process on a daily basis. Check out what you can do with ZoomCharts charts and graphs at http://zoomcharts.com In this PBS Digital Studios Off Book video Edward Tufte - Yale University, Julie Steele - O'Reilly Media, Josh Smith - Hyperakt, Jer Thorp - Office for Creative Research explain the art of data visualization and its evolution. Check out ZoomCharts products: Network Chart Big network exploration Explore linked data sets. Highlight relevant data with dynamic filters and visual styles. Incremental data loading. Exploration with focus nodes. Time Chart Time navigation and exploration tool Browse activity logs, select time ranges. Multiple data series and value axes. Switch between time units. Pie Chart Amazingly intuitive hierarchical data exploration Get quick overview of your data and drill down when necessary. All in a single easy to use chart. Facet Chart Scrollable bar chart with drill-down Compare values side by side and provide easy access to the long tail. ZoomCharts http://www.zoomcharts.com The world’s most interactive data visualization software

E N D
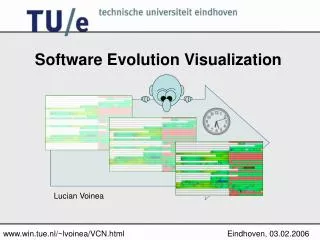
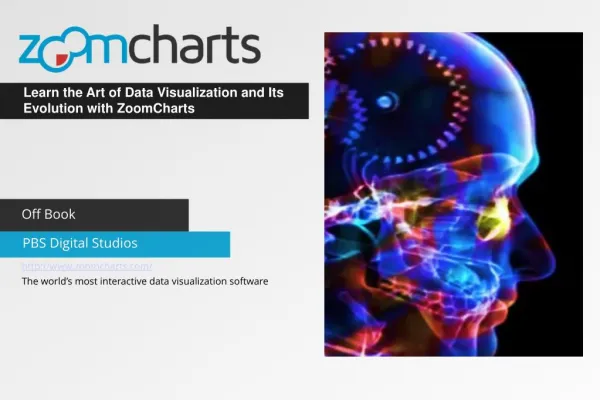
Learn the Art of Data Visualization and Its Evolution with ZoomCharts Off Book PBS Digital Studios http://www.zoomcharts.com/ The world’s most interactive data visualization software
Learn the Art of Data Visualization and Its Evolution with ZoomCharts Don’t limit yourself to infographics and static charts. With the ZoomCharts interactive data visualization software you can bring your presentations to the next level through its speed and interactivity. Data visualization has become a big part of our everyday life because of the amount of information we have to accumulate and process on a daily basis. Check out what you can do with ZoomCharts charts and graphs at http://zoomcharts.com In this PBS Digital Studios Off Book video Edward Tufte - Yale University, Julie Steele - O'Reilly Media, Josh Smith - Hyperakt, Jer Thorp - Office for Creative Research explain the art of data visualization and its evolution.
Learn the Art of Data Visualization and Its Evolution with ZoomCharts
Check out ZoomCharts products: Network Chart Big network exploration Explore linked data sets. Highlight relevant data with dynamic filters and visual styles. Incremental data loading. Exploration with focus nodes. Time Chart Time navigation and exploration tool Browse activity logs, select time ranges. Multiple data series and value axes. Switch between time units. Pie Chart Amazingly intuitive hierarchical data exploration Get quick overview of your data and drill down when necessary. All in a single easy to use chart. Facet Chart Scrollable bar chart with drill-down Compare values side by side and provide easy access to the long tail. ZoomCharts http://www.zoomcharts.com/ The world’s most interactive data visualization software