Download

1 / 60
600 likes | 716 Views
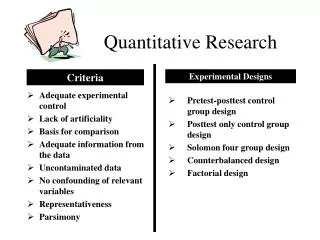
Week 4 ETEC 668 Quantitative Research in Educational Technology. Dr . Seungoh Paek February 5, 2014. Tonight ’ s Agenda. Research Presentations Introduction to SPSS Group Discussion. Research Presentations. Groups. Alicia & Rochelle Chloe & Nat Joe & Penn Jonathan & Yasmin

E N D
Week 4 ETEC 668 Quantitative Research in Educational Technology Dr. Seungoh Paek February 5, 2014
Tonight’s Agenda • Research Presentations • Introduction to SPSS • Group Discussion
Groups • Alicia & Rochelle • Chloe & Nat • Joe & Penn • Jonathan & Yasmin Number Generator
Let’s review… • What are the four types of measurement scales? (Clue: N.O.I.R) • Nominal • Ordinal • Interval • Ratio
When to use which … 1 2 3 4 5
Sigma Freud & Descriptive Statistics Chapter 2 & Chapter 3
R • R is a free software environment for statistical computing and graphics.
RStudio • RStudio is a free and open source integrated development environment (IDE) for R, a programming language for statistical computing and graphics.
PSPP Download PSPP - For Mac, click here. For Window, click here.
Sigma Freud & Descriptive Statistics A Picture is Really Worth a Thousand Words
Outline • Why pictures are worth “a thousand words” • How to create: • Histogram • Polygon • UsingSPSS to create & modify charts • Different types of charts and their uses
Why Illustrate Data? • When describing a set of scores you will want to use two things… • One score for describing the group of data • Measure of Central Tendency • Measure of how diverse or different the scores are from one another • Measure of Variability/Dispersion • However, a visual representation of these two measures is much more effective when examining distributions.
Ten Ways to a Great Figure • Minimize the “junk” • Plan before you start creating • Say what you mean…mean what you say • Label everything • Communicate ONE idea • Keep things balanced • Maintain the scale in the graph • Remember…simple is best • Limit the number of words • The chart alone should convey what you want to say
Frequency Distributions • Method of tallying, and representing the number of times a certain score occurs • Group scores into interval classes/ranges • Creating class intervals • Range of 2, 5, 10, or 20 data points • 10 -20 data points cover entire range of data • List class interval with a multiple of the interval • Largest interval goes at the top
Histograms • Class Intervals Along the x-Axis
Histograms Hand Drawn Histogram
Frequency Polygon • “continuous line that represents the frequencies of scores within a class interval”
Fat & Skinny of Frequency Distributions • Distributions can be different in four different ways… • Average value • Variability • Skewness • Kurtosis
Skewness (lack of symmetry/lopsidedness) • Positive & Negative Skewness
Kurtosis (flat vs. peaked) • Platykurtic (flat) & Leptokurtic (peaked)
Cool Ways to Chart Data • Column Chart
Cool Ways to Chart Data • Line Chart
Cool Ways to Chart Data • Pie Chart
Using the Computer to Illustrate Data • Creating Histogram Graphs
Using the Computer to Illustrate Data • Creating Bar Graphs
Using the Computer to Illustrate Data • Creating Line Graphs
Using the Computer to Illustrate Data • Creating Pie Graphs
7-part Model for Conceptualizing Quantitative Ed Tech Research • Select a Topic • Identify the Research Problem • Conduct a Literature Review • State the Research questions and hypotheses • Determine the Research Design • Determine the Methods • Identify Data Analysis Procedures
Purposes of Literature Review in Quantitative Research • Clarify the research project • Clarify the research problem • Verify the significance of the research problem – worth studying ? • Specify the purpose of the study • Identify relevant studies • Identify relevant theories • Clarify research subproblems
Purposes of Literature Review in Quantitative Research • Develop definitions of major variables • Identify limitations and assumptions • Select a research design • Identify tools of measurement • Direct data collection & analysis • Interpret findings
Use of the Literature • In quantitative research, typically there’s substantial amount of literature at the beginning of a study to: • provide direction for the research questions or hypotheses. • describe a problem • introduce a theory • Deductively as a framework for the research questions or hypotheses • At the end of study, literature is revisited to compare the results with existing findings in the literature
Steps in Conducting Lit Review • Identify key words, descriptors, useful in locating materials in a library • With key words in mind, search library catalogs, focus initially on journals & books related to topic • Search online databases typically reviewed by social science researchers, e.g ERIC, PsycINFO, ProQuest, Google Scholar, etc. • Initially, try to locate about 50 research articles or books related to your topic
Steps in Conducting Lit Review • Skim this initial group of articles or chapters & duplicate those that are central to your topic • As you find useful literature, create a literature map – visual picture of groupings of literature on the topic • Draft summaries of the most relevant articles – include precise citations for the articles using APA, preferably use EndNotes
Steps in Conducting Lit Review • Assemble the lit review by organizing it thematically or by important concepts • End the lit review with a summary of the major themes and suggest how your study further adds to the literature.
Priority for Selecting Literature Material • Begin with broad synthesis of the literature, e.g. summaries of the literature on your topic in journal article, encyclopedia. • Next, look for refereed journal articles in respected, national journal. Start with most recent issues and work backward in time. • Follow up on references/bibliographies at the end of key articles for more sources • Turn to books related to the topic • Next search recent conference papers • Time permitting, scan the entries in Dissertation Abstracts • Also search the Web
Possible Group Research Project Topic Group Research Project
7-part Model for Conceptualizing Quantitative Ed Tech Research • Select a Topic • Identify the Research Problem • Conduct a Literature Review • State the Research questions and hypotheses • Determine the Research Design • Determine the Methods • Identify Data Analysis Procedures
Selecting a Topic • Identify general area of interest, focus • Find something that you’re passionate about • Topic that would “make a difference” • Something fun that you’re curious about (hopefully!) • Groups’ topic areas – future schools; cyber charter school; tech integration; what else?