Download
1 / 70
710 likes | 874 Views
M. Dolores Cimini, Ph.D. Assistant Director for Prevention & Program Evaluation University at Albany, SUNY “Mental Health on Campus: We all Play a Part!” Ohio Program for Campus Safety and Mental Health Conference May 20, 2014

E N D
M. Dolores Cimini, Ph.D. Assistant Director for Prevention & Program Evaluation University at Albany, SUNY “Mental Health on Campus: We all Play a Part!” Ohio Program for Campus Safety and Mental Health Conference May 20, 2014 Columbus State Community College Conference Center, Columbus, Ohio Integrating Targeted Screening& Brief Intervention Strategiesinto a Comprehensive Prevention Program
What Does the Research Say? • Up to ninety percent of college students drink alcohol • Twenty-five to fifty percent are “heavy” episodic or “binge” drinkers • Students who abuse alcohol are at high risk for a number of negative consequences
What Does the Research Say? Students who engage in heavy drinking are at risk for a host of negative alcohol-related consequences… • Each year, among college students, alcohol use contributes to: • 1,400 deaths (up to 1800) • 500,000 unintentional injuries • 600,000 assaults • 70,000 sexual assaults, acquaintance rapes Source:NIAAA Report on College Drinking, April 2002
What Does the Research Say? • Percentage of students who reported specific problems over the past year as a result of their alcohol use (Wechsler et al., 2002) • Got into trouble with the authorities: 7% • Got hurt or injured: 13% • Forgot what you did: 27% • Done something later regretted: 35% • Numbers rise for those students who report frequent “binge” drinking
Alcohol and Drug Use Disorders • Past year prevalence: • Alcohol abuse: 12.5% • Alcohol dependence: 8.1% • Any drug abuse: 2.3% • Any drug dependence: 5.6% • Only 3.9% of full-time college students with an alcohol use disorder received any alcohol services in the past year • Only 2.4% of those who screen positive and did not receive services perceived a need for services Wu, et al., (2007)
Substance Use Data from Monitoring the Future (2009) Any illicit drug • 35% report past year use Marijuana • 32% report past year use Any illicit drug other than marijuana • 15% report past year use • 6.7% Vicodin • 6.5% Narcotics other than heroin • 5.7% Amphetamines • 5.1% Hallucinogens • 5.0% Tranquilizers
Substance Use Data from Monitoring the Future (2009) Tobacco vs. Other Drugs • More students reported past year use of any illicit drug (35%) than did past year use of cigarettes (30%)
Health and Mental Health • Factors affecting academic performance as identified by students (ACHA, 2011): • 24.7% Stress • 17.8% Sleep difficulties • 16.5% Anxiety • 13.8% Cold/Flu/Sore throat • 11.6% Internet use/computer games • 11.5% Work • 10.1% Concern for a troubled friend/family member • 10.0% Depression • Consider ways in which alcohol could contribute to, exacerbate, or cause problems in each of the above factors
University at Albany Profile • University Center within 64-campus SUNY System • Urban Setting • Research University • NCAA Division I • Students: • Undergraduates - 13,457 • Graduate Students - 5,177 • Faculty: 967 • Employees: 4,197 • Degree Programs: • Undergraduate - 61 • Masters - 89 • Doctorate - 39
Data from National College Health Assessment, American College Health Association Spring 2000,2004 & 2006 In-Class Administrations and Entering Student Questionnaire (ESQ) Summer 2006 Administration Profile of Alcohol and Other Drug Use and Related Behaviors Reported by UAlbany Students Prior to Intervention Implementation
Number of Times Consumed 5 or More Drinks Within Last Two Weeks:Overall Comparisons-UAlbany
Relationship Between Alcohol Abuse and Reported Health Concerns UAlbany NCHA data tell us that students who engage in high-risk drinking are also more likely to report the following: Broken bones Chlamydia Genital Warts Gonorrhea High Cholesterol Mononucleosis Repetitive Stress Injury Strep Depression Other Substance Abuse Source: National College Health Assessment, American College Health Association Coordinated by E. Rivero, M. D. Cimini, B. Freidenberg, et al.
http://www.collegedrinkingprevention.gov/ Selecting Our Interventions:The NIAAA Report on College DrinkingApril 2002
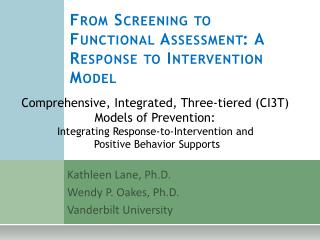
The 3-in-1 Framework • Individuals, Including At-Risk or Alcohol-Dependent Drinkers • Student Body as a Whole • College and the Surrounding Community From: “A Call to Action: Changing the Culture of Drinking at U.S. Colleges,” NIAAA Task Force
NIAAA Recommendations forClassifying Intervention Effectiveness Tier 1: Evidence of effectiveness among college students Tier 2: Evidence of success with general populations that could be applied to college environments Tier 3: Promising: Evidence of logical and theoretical promise, but require more comprehensive evaluation Tier 4: Ineffective: No Evidence of Effectiveness From: “A Call to Action: Changing the Culture of Drinking at U.S. Colleges,” NIAAA Task Force
Components of UAlbany Comprehensive AOD Prevention Program • Presidential Leadership • Campus AOD Task Force • Student Involvement/Leadership • Social Norms Marketing • Campus-Community Coalitions • Inclusive Academic Excellence • Healthy Living Communities • Alcohol-Free Activities • Early Intervention • Restricting Alcohol Marketing/Promotion • Policy Evaluation/Enforcement • Parental Involvement • Treatment & Referral • Research and Program Evaluation - NCHIP Comprehensive Program
Spectrum of Intervention Response:Alcohol Abuse Prevention Reclaim Health Optimize Health& Wellbeing Treat Problems Prevent Problems • Specialized Treatment • Outpatient Assessment, • Treatment, & Referral • Early Intervention • BASICS • ASTP Groups • Interactive Education • with Social Norms • AA Meetings • Consistent Policy Enforcement • Health Promotion • Social Norms Campaigns • Peer Services • Committee on University & Community Relations • Healthy Living Communities
Timeline: Evidence-based PracticeImplementation & Evaluation 2006: Committee on University & Community Relations Social Norms Project Present: Continued Implementation & Evaluation of Effective Programs 2009: Project Greek STEPS 2005: Project First STEPS 2011: National Registry of Evidence-based programs & Practices 2006: Project Healthy STEPS 2006: Project Winning STEPS 2010: STEPS Program Awards
The STEPS Model:Alcohol Abuse Prevention & Early Intervention
Screening and Follow-UpAssessment Measures: Survey Instruments for Project Participants • Alcohol Use Disorders Identification Test (AUDIT) • GPRA Assessment Tool • Center for Epidemiological Studies-Depression Scale (CES-D) • Daily Drinking Questionnaire (DDQ) • Brief Alcohol Expectancies Questionnaire (BAEQ) • Drinking Norms Rating Form (DNRF) • Protective Behaviors Strategies Scale (PBSS) • Readiness to Change Scale (RTC) • Rutgers Alcohol Problem Index (RAPI) • Brief Drinker Profile Campus-Wide Surveillance Data • The National College Health Assessment, American College Health Association (NCHA)
Brief Alcohol Screening and Interventionfor College Students Feedback Profile • Typical Drinking Pattern • Blood Alcohol Levels • Drinking Norms • Biphasic Curve • Beliefs about Alcohol Effects • Alcohol-Related Problems • Calories consumed • Financial Costs of Drinking • Alcohol Use & Sex • Family History • Protective Factors • Athletic Performance
Tier 1: Evidence of EffectivenessAmong College Students • Combining cognitive-behavioral skills with norms clarification and motivational enhancement interventions. • Offering brief motivational enhancement interventions. • Challenging alcohol expectancies From: “A Call to Action: Changing the Culture of Drinking at U.S. Colleges,” NIAAA Task Force
The Stages of Change Model(Prochaska & DiClemente, 1982, 1984, 1985, 1986) • Precontemplation • Contemplation • Preparation/Determination • Action • Maintenance
Stages of Change in Substance Abuse and Dependence: Intervention Strategies Maintenance of Recovery Stage Precontemplation Stage Contemplation Stage Action Stage Relapse Stage MOTIVATIONAL ENHANCEMENT STRATEGIES ASSESSMENT AND TREATMENT MATCHING RELAPSE PREVENTION & MANAGEMENT
Motivational Interviewing Basic Principles(Miller and Rollnick, 1991, 2002) Express Empathy Develop Discrepancy Roll with Resistance Support Self-Efficacy
Norms Clarification • Examines students’ perceptions about: • Acceptability of excessive drinking behavior • Perceptions about the drinking rates of their peers • Perception about the drinking prevalence of their peers
Cognitive-Behavioral Skills Training • Moderate drinking skills • Blood alcohol concentration discrimination • Altering expectancies about alcohol’s effects • Assertiveness skills (drink refusal) • Relaxation/Stress Management skills • Lifestyle balance skills • “Alcohol specific skills”
Alcohol’s Biphasic Effect Euphoria - Up Point of Diminishing Returns + Cultural Myth About Alcohol Feeling Scale 0 After Tolerance Develops __ Dysphoria - Down Time
Blood Alcohol ConcentrationAs a Function of Drinks Consumed & Time Taken to Consume Male 185 lbs. Hours No. of drinks
Tips for Reducing Alcohol Use Risk • Set limits • Keep track of how much you drink • Space your drinks • Alternate alcoholic drinks w/non-alcoholic drinks • Drink for quality, not quantity • Avoid drinking games • If you choose to drink, drink slowly • Don’t leave your drink unattended • Don’t accept a drink when you don’t know what’s in it
Negative Consequences • Academic Failure • Blackouts • Hangovers • Weight Gain • Tolerance • Decisions around sex • Impaired sleep • Sexual Assault • Finances • Family History • Alcohol-Related Accidents • Time Spent Intoxicated • Relationships • Legal Problems • Work-Related Problems
Protective Behaviors • Use a designated driver. • Have a friend let you know when you have had enough to drink. • Leave the bar/party at a predetermined time. • Make sure that you go home with a friend. • Know where your drink has been at all times. • Drink only with close friends. • Avoid mixing different types of alcohol. • Drink slowly, rather than gulp or chug. • Avoid trying to "keep up" or "outdrink" others. • Put extra ice in your drink. • Do not go to parties/bars alone. • Avoid drinks that contain multiple shots of alcohol. • Avoid drinking when angry, sad, or otherwise upset. • Eating before/during drinking. • Determine not to exceed a set number of drinks. • Alternate alcoholic and non-alcoholic drinks. • Avoid drinking games. • Avoid drinking shots of liquor. • Stop drinking at a predetermined time. • Drink water while drinking alcohol.
EXPECT Alcohol No Alcohol GET No Alcohol Alcohol
STEPS Program Outcomes:Number of Drinks Per Week 19% decrease
STEPS Program Outcomes:Percent of Students Experiencing Violence 25.7% decrease***
Social Norms Interventions:UAlbany’s Target Populations All Students Student Athletes 1stYear Students
62% 2012 57% 2010 57% 2008 53% 2006 50% 2004
85% 2012 80% 2010 80% 2008 82% 2006 80% 2004
80% 2012 76% 2010 74% 2008 74% 2006 70% 2004
UAlbany Student Health Survey: Overall Changes in Campus Culture
Alcohol Use Over 30 Day Interval Percent of students * * * * Significant *p <.05 Number of Days per Month