Download
1 / 39
390 likes | 754 Views
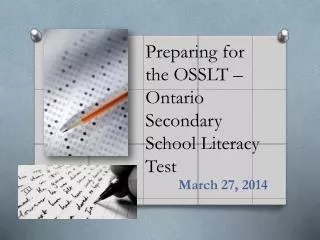
Preparing for the 2014 OSSLT. Graphic Text and Multiple Choice. Today’s Session. The Objective: To provide students with an opportunity to receive guided instructions on graphic texts and answering multiple choice questions. Overview of Today’s Session. What are Graphic Texts?

E N D
Preparing for the 2014 OSSLT Graphic Text and Multiple Choice
Today’s Session The Objective: • To provide students with an opportunity to receive guided instructions on graphic texts and answering multiple choice questions.
Overview of Today’s Session What are Graphic Texts? Samples of Graphic Texts Review of Multiple Choice Questions Set the stage for the next 4 days
What is a Graphic Text? • It is a way to communicate information to a reader on a given topic by way of a diagram, drawing, graph, schedule, map, chart, table, timeline, etc.
What is the purpose of a Graphic Text? • A graphic text communicates information in a concise format and illustrates how one piece of information is related to another.
What are some common features you notice on all of the sample graphic texts?
Features of a graphic text include: • Print Features • Organizational Features • These features allow for information to be conveyed quickly to the reader.
Think Aloud – Graphic Text #1 • Title • Diagrams • Headings • Subheadings • Arrows • Table • Image/Photo • Text
Graphic Text Features • Print Features • Typeface and sizeoftype • Bullets • Titles • Headings • Subheadings • Italics • Bold
Graphic Text Features • Organizational Features • Legends • Arrows • Charts • Graphs (line, bar, etc.) • Labels • Diagram • Table • Captions
Tips for Reading Graphic Text • Before Reading • Read the title, headings, captions, and diagrams. • Recall the information you already know about the topic.
Tips for Reading Graphic Text • During Reading • Read all of the text. Read the labels and how they are related to the graphic. Bold font, large font, capital letters usually convey important information. • Follow the arrows and lines. They show movement or direction, or connect ideas to one another.
Tips for Reading Graphic Text • During Reading • Look at symbols and shadings. Graphics that include these often include a legend to explain what symbols and shadings represent. • Identify the relationship between the visuals and information presented.
Multiple Choice Questions Both booklets will feature Multiple Choice Questions Multiple Choice Questions will have 4 possible answers. You are looking for the most correct answer of the 4 possibilities.
Multiple Choice Strategies • Read the questions beforeyou read the text. This will bring focus to your reading. • Use process of elimination. Cross out answers that you know are wrong answers.
Multiple Choice Strategies • Look for importantwords in the question and try to find the same wordsin the text. • Underline, highlight or circle these words and reread that part of the text to help you with the answer.
Multiple Choice Strategies • Choose the most correctanswer. • Trust your instincts.
GRAPHIC TEXT #2 Multiple Choice Think Aloud
Graphic Text #2 - MC – Think Aloud • Which part of the selection best shows an "explosion" in soybean production in Canada? a. the world map b. the "Uses for Soybeans" text boxes c. the "Soybean Production in Canada" graph d. the "Most Valuable Cash Crops in Canada" graph
1. Which part of the selection best shows an "explosion" in soybean production in Canada? • Examine the question and highlight keywords • An explosion means a huge growth in this context • Look at the possible answers • Scan the graphic – looking at the headings • Soybean Production in Canada is one of the headings for the line graph • An examination of the graph shows a huge growth • Answer is C
Graphic Text #2 - MC – Think Aloud 2. What describes the relationship between the world map and the graphics at the bottom of the page? a. from general to specific location b. from more to less valuable crops c. from past to more recent production d. from most productive to least productive
2. What describes the relationship between the world map and the graphics at the bottom of the page? • Examine the question and highlight keywords • Examine the possible answers • Identify what the world map is depicting (headings) • Identify what the graphics are depicting (headings) • What is similar between the 3 graphs and compare to the world map (Canada and world) • Process of elimination based on possible answers • B, C, D answers - do not fit all the graphs • Answer is A
Graphic Text #2 - MC – Think Aloud 3. What do the white numbers in the black circles on the world map represent? a. rank in soybean use b. rank in soybean production c. total area of soybean crops, in millions of hectares d. total soybeans produced annually, in millions of tonnes
3. What do the white numbers in the black circles on the world map represent? • Examine the question and highlight keywords • Examine the possible answers • Look at the world map and the heading “Top 10 soybean-producing nations” • Process of elimination using the possible answers • “Rank” means to order from top to bottom and the numbers (1-10) go from greatest to fewest • Eliminate A and C • Eliminate D (does not coincide with the white numbers) • Answer is B
Graphic Text #2 - MC – Think Aloud 4. Between which years did soybean production in Canada increase most significantly? a. 1961-1971 b. 1971-1981 c. 1981-1991 d. 1991-2001
4. Between which years did soybean production in Canada increase most significantly? • Examine the question and highlight keywords • Examine the possible answers • Look at the graphics and focus on the line graph titled “Soybean Production in Canada” • Identify the years with most growth (steepest incline) • Answer is D
Graphic Text #2 - MC – Think Aloud 5. How are the provinces organized in the "Hectares of Soybeans Grown" table? • a. from east to west • b. from west to east • c. from largest to smallest • d. from smallest to largest
5. How are the provinces organized in the "Hectares of Soybeans Grown" table? • Examine the question and highlight keywords • Examine the possible answers • Examine the table – "Hectares of Soybeans Grown" • the numbers do not seem to follow any order • eliminate Answers C and D • Recall the map of Canada and remember the placement of each province • Answer is A
Graphic Text #2 - MC – Think Aloud 6. Which two countries were most similar in their soybean production in 2000-2005? a. Italy and Indonesia b. Paraguay and India c. Canada and Bolivia d. China and Argentina
6. Which two countries were most similar in their soybean production in 2000-2005? • Examine the question and highlight keywords • Examine the possible answers • Look at each pair of countries and compare the production numbers • Eliminate a response if it has a greater difference than the previous answer • Eliminate Answers B, C, D • Answer is A
The OSSLT will be written on ... Thursday March 27, 2014 You will be taking your “Graphic Texts package” along with your Don’t Panic books to all of your classes over the next three days. Please return to your period two class.
References • The graphic texts and questions used in this presentation were taken from eqao.com -OSSLT Test Preparation and previous released tests.