Download
1 / 13
130 likes | 217 Views
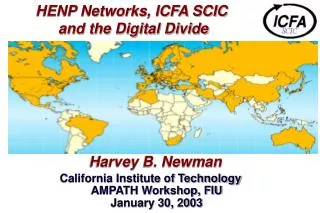
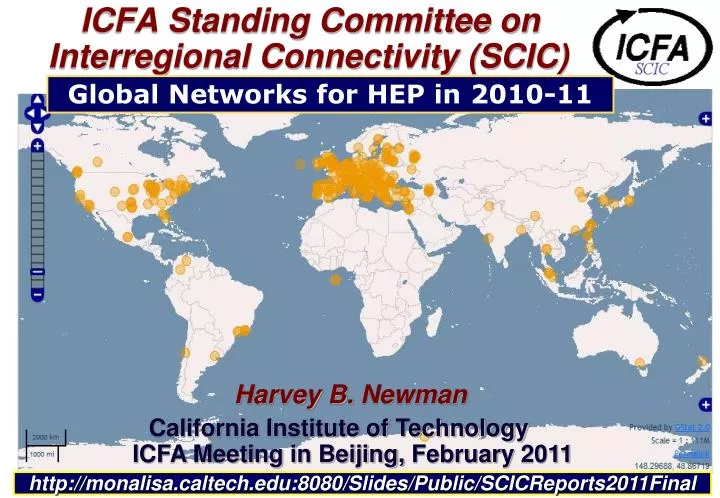
Global Networks for HEP in 2010-11. ICFA Standing Committee on Interregional Connectivity (SCIC). Harvey B. Newman California Institute of Technology ICFA Meeting in Beijing, February 2011. http:// monalisa.caltech.edu:8080/Slides/Public/SCICReports2011Final.

E N D
Global Networks for HEP in 2010-11 ICFA Standing Committee onInterregional Connectivity (SCIC) Harvey B. Newman California Institute of TechnologyICFA Meeting in Beijing, February 2011 http://monalisa.caltech.edu:8080/Slides/Public/SCICReports2011Final
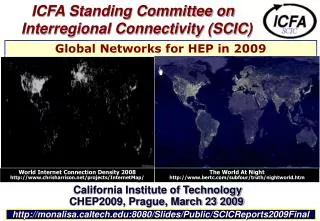
Monitoring the World’s NetworksSCIC Monitoring Group (R. Cottrell et al.) Mapping the Digital Divide
Number of Hosts Monitored By Region: 1998 - 2010 R. Cottrell Latin America Africa Africa
Normalized TCP Throughput in 2010 vs. UN Human Development Index (HDI) UNDP HDI: • A long and healthy life, as measured by life expectancy at birth • Knowledge as measured by the adult literacy rate (with 2/3 weight) and the combined primary, secondary and tertiary growth enrollment ratio (with 1/3 weight) • A decent standard of living, as measured byGDP per capita 1.0 0.8 0.6 0.4 10M 100k 1M Normalized Throughput (bps) A Clear Correlation Between the UNDP HDI and the Throughput
Apparent Reduction of RTT below 400ms, Impact of new Fiber / Terrestial routes MinRTT(ms), 2009 MinRTT(ms) Sep-Nov 2010 R. Cottrell
Minimum Round Trip Time (RTT) for From SLAC to Countries of the WorldSeptember 2010 800 msec Showing the effect of the use of Geo-stationary Satellites (270 msec and up) Vs. Terrestrial fiber optic networks 600 400 200 R. Cottrell 2010
Normalized TCP Throughput Trends Seen from CERN 1998-2009 Little Improvement to Africa over the last eight years R. Cottrell
Derived Throughputs Within and Among World Regions (kbps), Nov 2010
PingER Project Issue: Funding for Managing the Effort • The management and operation includes maintaining data collection and archiving, explaining needs, identifying and reopening broken connections, identifying and opening firewall blocks, finding replacement hosts, making limited special analyses and case studies, preparing and making presentations, responding to questions. The equipment performing this is currently in place at both SLAC and FNAL. • Management, operation and supervision requires central funding at a level of about 20% of a Full Time Equivalent (FTE) person, plus travel.This had been provided by discretionary funding from the HEP budgets of SLAC and FNAL, until the beginning of 2008.
PingER: Uncertainty for the Future • Many agencies/organizations have expressed interest (e.gDoE, ESnet, NSF, ICFA, ICTP, IDRC, UNESCO, IHY) in this work but none have so far stepped up to funding the management and operation. • Without funding, for the operational side, the future of PingER and reports such as this one is unclear, and the level of effort sustained in previous years will not be possible.
Key Network Report Updates, from 2010 to 2011 • The addition of information from a new case study of the impact of newer terrestrial (sub-marine) fibres coming into production on the East and West Coasts of Africa (see Appendix A: Sub-Saharan Africa - Fibre Updates for year 2010). • Deployment of new PingER Monitoring nodes in Mexico, Nepal, Egypt and several in Pakistan. We now have ~ 70 active monitoring hosts (an increase of ~20 hosts since last year) in 22 countries. (see Appendix B: New PingER monitoring nodes in Egypt, Mexico, Nepal and Pakistan). • Deployment of PerfSONAR in Pakistan (see Appendix C: Deployment of PerfSONAR in Pakistan). • Management of TULIP active landmarks: adding and subtracting as they fail and recover (see Appendix E: Management of TULIP active landmarks). • Mention of 4 publications and 4 lectures (see 2010 Digital Divide Publications/Presentations). • Extension of the PingER archive/analysis/presentation toolkit for the host in Pakistan.
Accomplishments Since 2008 • We have extended the measurements to cover more developing countries and to increase the number of hosts monitored in each developing country. • We have carefully evaluated the routes and minimum ping RTTs to verify that hosts are where they are identified to be in our database. As a result we have worked with contacts in relevant countries and sites to find alternatives, and about 20-30 hosts have been replaced by more appropriate hosts. • Since December of 2006, we have added a net of over 230 new remote hosts, and added 51 countries (Africa: BF, CD, CV, CI, DJ, GA, GM, GH, GW, LR, LY, MU, NA, SC, SL, SZ, TG, ZM; Balkans/S.E. Europe: BA, LV, MD; Central Asia: TM, Europe: AD, AT, BE, BG, CZ, FO, GI, LI, LU, SM, SE; Latin America: AN, BS, CO, CU, DO, NI; Middle East: AE, BH, OM, QA, SA; South East Asia: KH, LA, PH, TH; South Asia: AF, BT, MV). • While ping blocking is still a big problem as many hosts start blocking over time, no countries were lost this year.