Download
1 / 39
390 likes | 520 Views
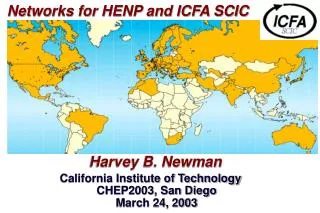
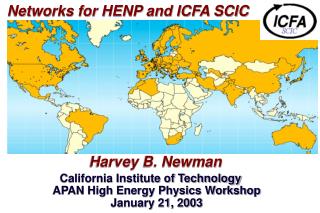
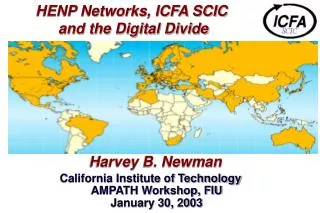
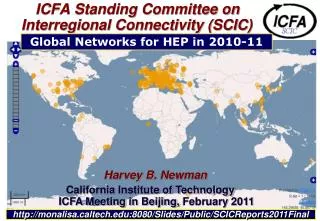
World Internet Connection Density 2008 http://www.chrisharrison.net/projects/InternetMap/. The World At Night http://www.bertc.com/subfour/truth/nightworld.htm. ICFA Standing Committee on Interregional Connectivity (SCIC). Global Networks for HEP in 2009. Harvey B. Newman

E N D
World Internet Connection Density 2008 http://www.chrisharrison.net/projects/InternetMap/ The World At Night http://www.bertc.com/subfour/truth/nightworld.htm ICFA Standing Committee onInterregional Connectivity (SCIC) Global Networks for HEP in 2009 Harvey B. Newman California Institute of TechnologyCHEP2009, Prague, March 23 2009 http://monalisa.caltech.edu:8080/Slides/Public/SCICReports2009Final
SCIC in 2009http://cern.ch/icfa-scic Three 2009 Reports: An Eventful YearRapid Progress, Dawn of an Era; Deepening Digital Divide • Main Report: “Networking for HEP”[HN, A. Mughal et al.] • Includes Updates on the Digital Divide, World Network Status; Brief Updates on Monitoring, Advanced Technologies; Focus on Digital Divide Issues • 39 Annexes: A World Network Overview Status and Plans of Nat’l & Regional Networks, HEP Labs, & Optical Net Initiatives [35 Updated in 2009] • Monitoring Working Group Report[R. Cottrell, U. Kalim] Also See: • TERENA 2008 Compendium(www.terena.nl): R&E Networks in Europe • http://internetworldstats.com: Worldwide Internet Use • OECD Broadband Portalhttp://www.oecd.org/sti/ict/broadbandBroadband: the new Digital Divide ? • SCIC 2003 Digital Divide Report [A. Santoro et al.]
1st Revolution: “Long Dawn” of the Information Age 1.6B Internet Users; 400+M with Broadband (12/31/08)http://internetworldstats.com Revolutions in Networking • Explosion of BW Use: Now ~4,000 PB/mo • Raw capacity still mostly unused • Rise of broadband • Rise of Video + Mobile Traffic: ~20 ExabytesPer mo. (64%) by 2013 • Web 2.0: Billions of Web Pages, embedded apps. • Facebook, Twitter, Skype, iPhone/Gphone, GEarth; Skype • Beginnings of Web 3.0: streaming content; ubiquitous information World Penetration Rates (12/31/08) North Am. 73% Australasia/Oceana 60% 49% Europe 24% Latin Am. 23% World Av. Mid. East 22% Asia 17% Africa 5.4% 0 % 10 20 30 40 50 60 70 80 Broadband: 80M Each in the US and China
SCIC Report 2009 - Main Trends Accelerate:Dark Fiber Nets, Dynamic Circuits, 40-100G • Current generation of 10 Gbps network backbones and major Int’l links arrived in 2002-8 in US, Europe, Japan, Korea; Now China • Bandwidth Growth: from 16X to 10,000X in 7 Yrs. >> Moore’s Law • Proliferation of 10G links across the Atlantic & Pacific since 2005 • Bandwidth for LHC well above 100 Gbps, in aggregate • Rapid Spread of “Dark Fiber” and DWDM: Emergence of Continental, Nat’l, State & MetroN X 10G “Hybrid” Networks in Many Nations • Demand may still exceed capacity by ~2010, in some regions • Point-to-point “Light-paths” for HEP and “Data Intensive Science” • Now Dynamic Circuits, and Managed Bandwidth Channels • Technology continues to drive Performance Higher, Costs Lower • Commoditization of GE now 10 GE ports on servers • Multicore processors with Multi-Gbyte/sec interconnects • Cheaper and faster storage ($ < 100/Tbyte); 100+ Mbyte/sec disks • Transition to 40G, 100G links from 2011 (on land), ~2012 (sub-sea) • Outlook:Continued growth in bandwidth deployment & use
Core NREN Capacity of EU/EFTA Countries 2004-2008 100G TERENA Compendium 2008: www.terena.org/activities/compendium/ 20G 10G 1G 0.1G de hu ie be cy dk fi lv lu nl pl ro si se uk fr is it at lt sk cz ee gr no pt ch bg mt es
LHC Optical Private Network (The LHCOPN) • Close collaboration with CERN & GEANT2 (11 10G Links) • Working with GEANT2 to achieve fiber diversity for European circuits to/from CERN • Inter-Tier1 links for resilience, redundancy: • BNL, FNAL: US LHCNet • CNAF, SARA, GridKa, IN2P3: Cross-border dark fiber • RAL (UK): 2nd 10G in Process • NDGF, ASGC, Taiwan, TRIUMF: Reduced BW backup • PIC (Spain): Still no backup • Evolution to N X 10 Gbps: Fermilab, BNL, US LHCNet; SURFnet, GARR-X Edoardo Martelli (CERN)
GÉANT2 Pan-European Backbone • Dark Fiber CoreAmong 19 Countries: • Austria • Belgium • Croatia • Czech Republic • Denmark • Finland • France • Germany • Hungary • Ireland • Italy • Netherlands • Norway • Slovakia • Slovenia • Spain • Sweden • Switzerland • United Kingdom 34 NRENs, ~30M Users; 50k km Leased Lines 12k km Dark Fiber; Point to Point Services GN3 Next Gen. Network Proposed 9/2008 Projected Start Q2 2009 C. Stover (DANTE)
PNNL CHI-SL INEEL LIGO US LHCNet 10Gb/s US LHCNet 20 Gb/s International (high speed) 10 Gb/s SDN core 10G/s IP core MAN rings (≥ 10 G/s) Lab supplied links OC12 / GigEthernet OC3 (155 Mb/s) 45 Mb/s and less US LHCNet + ESnet4 Today ESNet4 Science Data Net Core (n*10 Gbps) In 2007 In 2008 BNL FNAL MIT Denver NYC NYC JGI LNOC ANL LLNL LBNL SNLL SURFNet AMES CHI NERSC Amsterdam SLAC IARC LANL GA CERN ESnet4 IP Core (10 Gbps) DOE-ALB US LHCNet (4x10Gbps) By 2006 US-LHCNet Plan 2008-10: 40, 60, 80 GbpsNY-CHI-GVA-AMS • Redundant “light-paths” to BNL and FNAL; dark fiber to FNAL • Connections to ESnet MANs in NYC & Chicago • 10 Gbps peerings with Abilene (2) and GEANT2
A Global Partnership of R&E Networks and Advanced R&D Projects Supporting the LHC Program 14 to 16 10G Trans- Atlantic Links in 2009 Partnership with Internet2, NLR, ESnet in the US
CMS Data Transfer Volume (May – Aug. 2007) 10 PetaBytes Transferred Over 4 Mos. = 8.0 Gbps Avg. (15 Gbps Peak) 2008: 9-12 Gbps T1-T2 Flows To UCSD, Nebraska, Caltech Computing Model Progress CMS Internal Review of Software and Computing
Remarkable Historical ESnet Traffic Trend Cont’d in 2008 Apr 2006 1 PBy/mo. • ESnet Traffic Increases by10X Every 47 Months on Avg.10 PBytes/mo. By ~July 2010Equal to 30 Gbps Continuous Nov 2001 100 TBy/mo. July 2010 10 PBy/mo. Jul 1998 10 TBy/mo. 53 months Oct 1993 1 TBy/mo. Aug 1990 100 MBy/mo. Terabytes / month 40 months 57 months 38 months J. Metzger Log Plot of ESnet Monthly Accepted Traffic, January 1990 – December 2008
Bandwidth Roadmap for Major Links (in Gbps): US LHCNet Example We are progressing along this roadmap Paralleled by ESnet Roadmap for Data Intensive Sciences
Science Network Requirements Aggregation Summary Immediate Requirements and Drivers for ESnet4 HENP: ~300 Gbps by 2013
ESnet Science Network Requirements Aggregation Summary Fusion + BES + Bioinformations ~Equal to HEP
ESnet4 www.es.net/ESNET4 50-60 Gbps by 2009-10; 500-600 Gbps 2011-12 US LHCNet to CERN (60-80; 120-180 Gbps) Europe (GEANT) Canada (CANARIE) Canada (CANARIE) Asia-Pacific Asia Pacific GLORIAD (Russia and China) Europe (GEANT) Asia-Pacific Science Data Network Core Seattle Cleveland Boston Australia Chicago IP Core Boise New York Kansas City Denver Washington DC Sunnyvale Atlanta Tulsa LA Albuquerque South America (AMPATH) Australia San Diego South America (AMPATH) Jacksonville IP core hubs Production IP core (10Gbps) SDN core (20-30-40Gbps) MANs (20-60 Gbps) or backbone loops for site access International connections SDN hubs Houston Primary DOE Labs 100 Gbps waves “production-ready” within ~1.5-2 years (Infinera; Also CIENA) High Speed Cross connects with Ineternet2/Abilene Possible hubs Fiber path is ~ 14,000 miles / 24,000 km
Implementation: US LHCNet Plan Phase 8 (2014): Transition to Full Use of 100G Followingan 8 PhasePlan 2007-2014 4 X 100GTrans- Atlantic Using OTU-4 (100G) Links+ Next-Gen. Optical Muxes
US LHCNet Bandwidth Roadmap Matches LHC Storage Roadmap 40G in 2008to 260G in 2013: 6.5X in 5 Yrs. Slower than historical trends: [20-100X]
Downward Price Evolution on TA 10G Links Continues (-31%/Yr 2005-8) Important for the LHC There Are Price “Bumps” Along the Way Prices in Other Regions are Higher Question How will 40 + 100G Link Prices Evolve in 2010-14 ?
Use of Dark Fiber in NREN Backbones 2005 – 2008Greater or Complete Reliance on Dark Fiber 2005 2008 TERENA Compendium 2008: www.terena.org/activities/compendium/
SURFNet and NetherLight: 8000 Km Dark FiberFlexible Photonic Infrastructure 5 Photonic Subnetsλ Switching Services to 10GFixed or Dynamic Lightpaths: LCG, GN2, EXPRES DEISA CineGrid Cross Border Fibers to Germany: X-Win; On to NORDUnet Erik-Jan Bos
POLAND:PIONIER 6000 km Dark Fiber Network in 2009 LCG/EGEE POLTIER2 Distributed Tier2 (Poznan, Warsaw, Cracow) Connects to Karlsruhe Tier1 Cross Border Dark Fiber Links to Russia, Lithuania, Belarus, Czech Republic, and Slovakia Existing 1Q 2009 4Q 2009 2 X 10G Among 20 Major University Centers R. Lichwala
Czech Republic: CESNET2 Reconfigurable Optical Backbone in 2009 2500+ km Dark Fibers(since 1999) N X 10 GbE Light-Paths 10 GbE CBDFSlovakiaPolandAustriaNetherlightGEANT2 H. Sverenyak Czech Tier2:1 Gigabit Lightpaths to the Tier1s at Fermilab, BNL, Karlsruhe and Taiwan;Similar scheme: it, br, nl, de, ….
SLOVAK Academic Network January 2009: Now~All 10 GbE Switched Ethernet ~10,000x Increase Since 2002 SANET to Schools 1GE to 500 Schools In 54 Cities By 2012 Weis Horvath http://www.sanet.sk/en/index.shtm • 2002 - 2004: Dark Fiber Links to Austria, Czech Republic, Poland • 2005-6: Complete 1 GbE links to all main sites • 2006: 10 GbE Cross-Border Dark Fiber to Austria & Czech Republic; 8 X 10G over 224 km with Nothing In-Line Deonstrated • 2007-8: Transition Backbone to 10G Done; All CB Dark Fibers to 10G
The Emergence of “Hybrid” Networks With Dynamic Circuits with BW Guarantees W. Johnston, ESnet On Circuit-Oriented Network Services Traffic Isolation; Security; Deadline Scheduling; Fairness; High Ultilization
US LHCNet Configuration (2H 2009)Non-stop Operation; Circuit-oriented Services Emerging StandardsVCAT, LCAS Also Internet2 and SINET3 (Japan) CIENA Core Directors Equipment and link Redundancy Robust fallback at layer 1 + next-generation hybrid optical network: Dynamic circuit-oriented network services with BW guarantees
Traffic on Circuits 2007 Outbound Traffic13.3 PBytes77% on Circuits: Peak 18 Gbps 6.7 Gbps Average Large Scale Flows Mostly Handled by Dynamic CircuitsUsing Software by Fermilab and Caltech
CMS data transfer between FNAL and UNL using Internet2's DCN and LambdaStation Software (FNAL + Caltech) Cumulative transfer volume (top) and data rates (bottom) Entire 50 TByte Tier2 Buffer Filled in ~1 Day 9 Gbps PeaksUsing Circuitson ESNet (Green)I2 DCN (Red)
NetherLight 2009: 37 Lambdas, 201 Gbps Convergence of Many Partners on Common Circuit Concepts Internet2, ESnet, GEANT2, US LHCNet; cz,nl, ru, es, tw, kr, hk, in, nordic; jp
SC08 Research Partners: FNAL, BNL, Florida, Michigan, Brazil, Korea; ESnet, NLR, FLR, Internet2, ESNet, CWave, AWave, IRNC, CANARIE, SURFNET ~512 CPU Cores and 100 10GE NICs in 1 Rack of Servers 64 10GE Switch Ports; ~100 TB Disk 40 30 In (Gbps) 20 10 0 10 20 30 40 Traffic: Out 50 60 70 Max. 114 Gbps; 110 Gbps Sustained; 71 Gbps Outbound Using FDT and FDT/dCache Storage to Storage
Caltech and CIENA: 191 Gbps Avg., 199.90 Gbps Max on An OTU4 (Standard 100G) Wave at SC2008 SC08 10 X 10G Waves at the Caltech HEP Booth Used Fully, in Both Directions with Caltech’s FDT (TCP-Based Java Application) Previewing the US LHCNet Transition to 4 X 100G by ~2014 1.02 Petabytes Overnight
Digital Divide: North Vs. South East Vs. West Plots Courtesy the PingER Project Data from http://internetworldstats.com
Work on the Digital Dividefrom Several Perspectives • Share Information: Monitoring, Tracking BW Progress; Dark Fiber Projects & Pricing • Track Planning (focus on LHC) and Leading Edge Progress • Model Cases: Poland, Slovakia, Czech Rep., Brazil, China … • Encourage Access to Dark Fiber; Modern technology choices • Raise Awareness: Locally, Regionally & Globally • Digital Divide Workshops [Rio, Gaegu, Cracow, Sinaia, Mexico City] • Diplomatic Events: WSIS, RSIS, Bilateral: US-South Asia, EU-Africa,… • Technical Help with Modernizing the Infrastructure: • Provide Tools for Effective Use: Data Transport, Monitoring, Remote Collaboration and e-Learning • Design, Commissioning, Development • India “Knowledge Network”, Brazil’s Nat’l and Int’l Networks • Encourage, and Work on Inter-Regional Projects • GLORIAD, Russia-China-Korea-US-Europe Optical Ring • Latin America: CHEPREO/WHREN (US-Brazil); RedCLARA • Mediterranean: EUMEDConnect; Asia-Pacific: TEIN3; Asia: ORIENT
SCIC Monitoring WG PingER (Also IEPM-BW) R. Cottrell Monitoring & Remote Nodes (1/09) • Measurements from 1995 On Reports link reliability & quality • Countries monitored • Contain 95.5% of world pop. • 99% of World’s Internet Users • 890 remote nodes at 650 sites in 165 nations; 45 monitoring nodes;95 Sites in 50 African countries • Strong Collaboration with ICTP Trieste and NUST/SEECS (Pakistan) • Excellent, Vital Work Countries:N. America (3), Latin America (21),Europe (33), Balkans (10),Africa (50), Middle East (13), Central Asia (9),South Asia (8), East Asia (4), SE Asia (10),Russia (1),China (1)andOceania (4)
Number of Hosts MonitoredBy Region: 1998 – End 2008 R. Cottrell Africa End
SCIC Monitoring WG - Throughput Improvements 1998-2008 30% annual improvement ~14X Per 10 yrs Progress: but Digital Divide is Mostly Maintained Behind Europe 3-6 Yrs: Russia, Latin America, SE Asia 9-12 Yrs: South Asia, Central Asia 16 Years: Africa 10M 1M Throughput (bps) South & Central Asia, Especially Africa are Falling Farther Behind:100X-1000X Worse by 2019 ? 100k http://www-iepm.slac.stanford.edu/ 10k 98 99 00 01 02 03 04 05 06 07 R. Cottrell 08 09 Bandwidth of TCP < MSS/(RTT*Sqrt(Loss)) Matthis et al., Computer Communication Review 27(3), July 1997
Brazil: RNP2 Next-Generation “Ipê” Backbone New vs. OldBandwidth 70 to 300X • 2007-9 Buildout of dark fiber nets in 27 cities: Connecting 200 Univ. & Institutes at 1 Gbps • 2009: Upgrade 2.5G Sao Paulo –Miami Link to 2 X 10G (RNP+ANSP+NSF) • 10G to Grid-UNESP Tier1, Tier2s in Rio and Sao Paulo • Dark Fiber (622 Mbps) across the Amazon Porto Velho to Manaus • Extending the Ipê Fiber footprint to the East and South M. Stanton
Three undersea cables cut: traffic greatly disturbed between Europe and Asia/Near East zone www.orange.com/en_EN/press/press_releases/att00006557/CP_cables_19dec08_EN.pdf France Telecom observed Dec. 19 that 3 major underwater cables were cut: “Sea Me We 4” at 7:28am, “Sea Me We3” at 7:33am and FLAG at 8:06am. Causes of the cut, located in the Mediterranean between Sicily and Tunisia, on sections linking Sicily to Egypt, remain unclear. Most traffic between Europe and Asia rerouted through the USA. Traffic from Europe to Near East & Asia interrupted to greater or lesser extent. First estimate of percentage of out-of-service capacity): Saudi Arabia: 55% out of service Djibouti: 71% out of service Egypt: 52% out of service UAE: 68% out of service India: 82% out of service Lebanon: 16% out of service Malaysia: 42% out of service Maldives: 100% out of service Pakistan: 51% out of service Qatar: 73% out of service Syria: 36% out of service Taiwan: 39% out of service Yemen: 38% out of service Zambia: 62% out of service
PingER Measurementsof the Impact of the Cuts on ThroughputVs. Time Cable Cuts on Dec. 19.Partial Recovery by Dec. 23 1 3 5 7 9 9 11 13 15 17 19 21 23 27 27
SCIC: Networks for HEPMain Conclusions for 2009 • The major R&E networks serving HEP have progressed rapidly over the last few years; to N X10G in many cases • Worldwide transition to 40G & 100G links will occur in 2010 – 14 • Our BW usage has kept pace; may soon outstrip the planned capacity • Groups in HEP have developed state of the art methods to use these networks most effectively • Widespread deployment, end-to-end monitoring, training required • Adapting the LHC Computing Models to fully exploit networks would have a profound positive impact on the LHC program • It is more urgent than ever that we act to Close the Digital Divide • To make physicists in all regions full partners in the discoveries • We are learning to do this effectively, in some cases, in partnership with many agencies & HEP groups: • Central Europe and Brazil; India and Pakistan • But we are leaving other countries and regions behind, for example: the Middle East, the Rest of Latin America; Africa • A great deal of work remains