Download
1 / 36
360 likes | 505 Views
HIRLAM mesoscale report. Oslo Meeting 12-13 December 2005. CONTENTS. 1) HIRLAM meso-scale experiences at model gridsizes below 10 km What is HIRLAM physics ? Operational or semi-operational verification results in HIRLAM countries Case study examples

E N D
HIRLAM mesoscalereport Oslo Meeting 12-13 December 2005
CONTENTS 1) HIRLAM meso-scale experiences at model gridsizes below 10 km What is HIRLAM physics ? Operational or semi-operational verification results in HIRLAM countries Case study examples Conclusions on HIRLAM model performance on meso γ-scale 2) HIRLAM experiences with running IFS/ALADIN including status of HIRLAM physics implementation. Strategy Examples Conclusions
What is HIRLAM-physics ? • HIRLAM physics has a long tradition since late 1980s • Many schemes for the key physical processes have been tested over the years. • The origin of the present schemes used for turbulence and surface parameterisation goes back to Météo-France. • The HIRLAM turbulence scheme is a special version of the socalled ”CBR-scheme” including TKE. This scheme has been developed for several years in HIRLAM context.
What is HIRLAM physics (2) • The HIRLAM surface scheme is a special version of ISBA (multi-tyle). • The HIRLAM project has followed an independent line with regard to radiation parameterisation and schemes for condensation, convection and cloud cover (STRACO, KF-RK ) • The HIRLAM physics perform quite well and are very stable together with the HIRLAM semi-Lagrangian scheme in the HIRLAM hydrostatic model at resolutions down to about 5 km.
HIRLAM runs in ”grey zone” It is becoming increasingly ’popular’ to run HIRLAM in the ’grey zone’ (≈ 3 km – 8 km) both for tests and on a daily basis ! • HIRLAM 5 km daily runs at INM • HIRLAM 5 km operational runs at DMI • HIRLAM 5 km daily runs at SMHI
INM 5km daily runs Preliminary evaluation: subjective: 1) near surface winds improved compared to coarser mesh results. 2) Low level clouds improved. Objective: Most parameters when verified with OBS-verification show similar results, but marginal improvements can be seen in some upper air fields , e.g. T(850 hPa), RH(500 hPa)
T(850 hPa) Aug-Oct. for 0.15 deg and 0.05 deg. models at INM
T(500 hPa) Aug-Oct 2005 for 0.15 deg and 0.05 deg. resolution models at INM
RH(500hPa ) Aug-Oct. 2005 for 0.15 deg. and 0.05 deg. models at INM
DMI operational experiences • 0.05 ˚ run compared to 0.15 ˚ run (40 levels) in OBS-verification: • Almost always significant improvement of 10m winds. 2m temperatures of similar or marginally better quality Precipitation scores are of similar quality both summer and winter (significant improvements in last few years) NOTEthat OBS-verification normally favours the low resolution output !
Diurnal cycle of T2m and V10m (August 2005, Danish synop stations)
DMI operational rms/bias for T2m and V10m in August 2005 (right) and November 2005 (left) for Danish synoptic stations
Diurnal cycle of 2m relative humidity in August 2005 (left) and October (right) verified for Danish synoptic stations.
DMI monthly precipitation scores for November 2005. Results of station sums are presented (T15 left, S05 right). Score based on daily contingency tables in lower right corner (66,6 %, 67.0 % respectively)
Greenland ’pieterak’-simulation (T15 compared to S05) Note that S05 only produce increased wind over part of the domain, e.g. at the ’Pieterak’ location. The strong winds were also observed (not shown)
SMHI preliminary experience with 5 km version and 60 vertical levels using Kain-Fritsch & Rasch-Kristjansson cloud scheme • Similar or marginally improvedscores for 2 metre temperature • Similar or slightly improved score for 10 metre wind • Degraded cloud cover and also dew point (too few clouds) • Increasing precipitation (somewhat excessive) • Slightly degraded MSLP
Meso-scale sensitivity studies of precipitation with HIRLAM at FMI: Summer cases of precipitation over Finland have been studied at grid resolutions of 11 km, 5.5 km and 2.8 km using HIRLAM hydrostatic model and HIRLAM-Tartu non-hydrostatic model. A publication from 2005: S. Niemela and C. Fortelius: ”Applicability of Large-Scale Convection and Condensation Parameterization to meso-γ scale in HIRLAM: A Case Study of a Convective Event ” Mon Wea. Rev. 133, 2422-2435, Aug. 2005
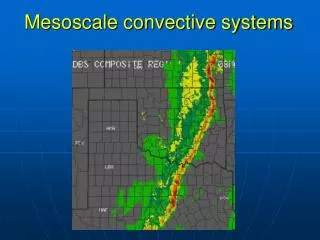
Main findings of Niemelä and Fortelius (2005) using different versions of the STRACO scheme including sensitivity test on the use of resolution dependent parameterization of convection. 1) The best results are obtained with non-hydrostatic dynamics, with a fully grid-size dependent convection scheme, (e.g. triggering mechanism etc. ) – The results for a 5 km grid spacing produced the best results and a radar reflectivity distribution that resembles the observed one surprisingly well ! 2) Experiments down to 2.8 km with no convection scheme (explicit condensation) cannot compete with experiments using full physics : Precipitation release is too much delayed with a wrong model frequency distribution of precipitation intensity ! 3) The scale dependent formulations of convection in the ”grey zone” is benefitial for the quality of the precipitation prediction, but the presently used formulations might be improved to be more optimal !
11 km small-scale convective showers on 25 May 2001 (Finland) 5.6 km Precipitation intensity simulations (Niemelä and Fortelius 2005) 2.8 km
NH HYD 5.6 km Dynamically forced convection case 27-29 July 2004 OBS
HIRLAMphysics in IFS/ALADIN Implementation strategy: • Adapt to existing coding practice in IFS/ALADIN whenever possible. • Adapt to existing code structures when interfacing HIRLAM physics. • Adapt to the reference system of equations of the new AROME forecasting system. • An initial implementation of HIRLAM physics should involve only a limited part of the physics in case that alternative schemes are available, in order to limit the efforts of first validations
HIRALD double nested system setupsGrid sizes: 10km (outer), 2.5 km (inner)
Experiences with default ALADIN physics (Cycle 29t2, no cloud condensate variables) *ALADIN non-hydrostatic model with ALADIN physics runs stably on a daily basis for grid sizes at 2.5 km and 40 levels in the vertical ( stable for 60 levels ?) *Precipitation forecasts are sometimes ”noisy” with a tendency to produce too much precipitation in some precipitation bands. *Precipitation has a problem to go ”across” mountains, e.g. the Norwegian mountains.
Precipitation forecast (2.5 km) withstandard ALADINphysic on 25 October 2005 from 6 UTC-18 UTC.
HIRLAM operational model accumulated precipitation at a grid size of 5.5 km on 25 October 2005 from 6 UTC -18 UTC.
Status of HIRLAM-physics in IFS/ALADIN 1) The processes of radiation, turbulence and convection/condensation have all been coded, and have been tested to some extent. Technically, the convection/condensation processes have been most difficult because of a more complicated computation of pseudo-fluxes. This involves some overhead because the flux terms were not previously computed. The tendency computations of the physics are not eliminated since the code should still work for the synoptic scale HIRLAM model system. 2) Some numerical stability problems were encountered during the test period after initial coding. Some of these problems have been caused by codingerrors, but other problems might be related to the combination of different physics packages (ALADIN turbulence + HIRLAM condensation and convection). Similar type of problems have been encountered at Meteo-France when testing the Lopez condensation scheme. 3) Daily numerically stable runs have started in late november 2005 using a HIRLAM scheme for condensation, convection and clouds. The remaining physics will be included early in 2006.
6h-18h acc. precipitation from standard ALADIN phys. run at DMI , resolution: 10 km, valid at 6. Dec 2005
6h-18h acc. precipitation from HIRLAM phys implementation in ALADIN , valid at 6. Dec 2005
Experimental test setup (10 km hydrostatic) ,6h-12h accumulated precipitation on 1 July 2003. (ALADIN phys)
Experimental test setup result with HIRLAM condensation/convection (STRACO), 6h-12h accumulated precipitation, 1 July 2003.
Conclusions (1) • Experience with daily runs of HIRLAM in ”grey zone” shows improved results for 10m winds and neutral or marginally improved results for 2m temperature compared to coarser mesh results. • The results for cloud and precipitation are mixed, depending on the choice for the physics used. • The results of scale depending convection is encouraging and indicate that planned new ALARO physics developments have good chances to produce improved results for the grey zone
Conclusions (2) • Implementation and test of HIRLAM physics in IFS/ALADIN is in good progress. • Daily runs with HIRLAM condensation/convection scheme will be extended to include the HIRLAM TKE scheme and the radiation scheme. • Phasing of HIRLAM physics into IFS will be done at a suitable time !