Download
1 / 46
470 likes | 740 Views
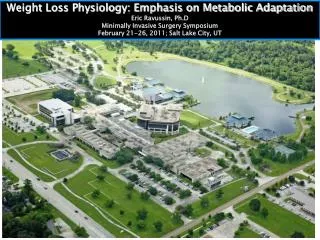
Physiology of Energy Expenditure Eric Ravussin Eric.Ravussin@pbrc.edu. DRUGS?. ENVIRONMENT. ACTIVITY?. Physical Environment. Energy Partitioning Fat Accretion. Obesity. Behaviors. Social Environment. Overweight. Adipogenesis. Biology. Energy Intake. Energy Expenditure.

E N D
Physiology of Energy Expenditure Eric Ravussin Eric.Ravussin@pbrc.edu DRUGS? ENVIRONMENT ACTIVITY?
Physical Environment Energy Partitioning Fat Accretion Obesity Behaviors Social Environment Overweight Adipogenesis Biology Energy Intake Energy Expenditure Bouchard and Rankinen, 2007
Obesogenic Behavior Obesogenic Environment Energy Partitioning Fat Accretion Obesity Overweight Adipogenesis Social Environment Built Environment Biology Energy Intake Energy Expenditure
Obesogenic Environment Environment Genetics 2 “Leptogenic” BMI (kg/m ) “Obesogenic” environment environment Traditional Environment Social Environment Built Environment 1900s 2000s Leptogenic Environment Obesity Susceptibility Obesity Susceptibility Genetics Obesity Resistant Obesity Prone Redman & Ravussin 2008
NHANES 1976-1980 NHANES 1999-2004 BMI distribution (%) Obese Overweight Extremely Obese Redman & Ravussin 2008
Putative Contributors to the Secular Increase in Obesity Besides more Food and less Activity 25 17.3 67.5 .50 32 26 80 67 4000 80 24 17.2 79 31 25.75 66.5 .49 79 3750 78 23 17.1 66 30 25.5 .48 77 78 65.5 3500 22 17 25.25 29 76 65 .47 77 25 28 21 16.9 3250 75 64.5 74 76 .46 24.75 27 64 20 16.8 3000 73 63.5 24.5 75 26 .45 19 16.7 72 2750 63 24.25 25 74 71 18 .44 62.5 16.6 2500 24 24 70 62 73 17 16.5 .43 Adult obesity prevalence (%) 69 Antidepressant prescriptions (millions) 2250 Nonsmoker prevalence (%) 23.75 23 61.5 Prevalence of AC (%) PBDE concentration (pg/g) Average home temperature (F) 72 Time spent awake (hours/day) Mean age of mothers at first birth (years) 68 16 16.4 61 .42 Proportion Hispanic and/or aged between 35 and 55 years 23.5 22 2000 67 71 60.5 15 16.3 23.25 21 .41 66 60 1750 70 23 14 16.2 65 20 59.5 .40 1500 69 64 59 22.75 19 13 16.1 63 .39 58.5 1225 68 22.5 18 12 16 62 58 .38 22.25 67 17 1000 61 57.5 11 15.9 22 60 16 57 66 .37 750 10 15.8 59 56.5 21.75 15 65 .36 500 58 56 9 15.7 21.5 14 64 57 55.5 .35 250 8 15.6 21.25 13 56 55 63 55 0 7 21 .34 15.5 12 54.5 1960 1965 1970 1975 1980 1985 1990 1995 2000 Prevalence of AC (%) Nonsmoker prevalence (%) Year Adult obesity prevalence (%) Proportion of Hispanicand/or aged between35 and 55 years Mean age of mothers at firstbirth (years) Average home temperature (F) Antidepressant prescriptions(millions) PBDE concentration (pg/g) Time spent awake(hours/day) Keith SW et al. Int J Obes. 2006;30:1585-1594; and McAlister et al., Crit Rev in Food Sci & Nutr, 2009.
Long-term Weight Homeostasis Principles of Energy Balance 1 % e r r o r = 1 kg / yr
Eucaloric Diet, 2500kcal/d Energy Stores > 60,000 kcal Energy Intake (kcal/day) Daily Oxidation (% stores) Carbohydrate 2,000 kcal 1,000 50-100% NO EFFECT ON ENERGY BALANCE Protein 40,000 kcal 500 1.3% NO EFFECT ON ENERGY BALANCE Fat 125,000 kcal 1,000 <1% DAILY FAT BALANCE = ENERGY BALANCE _ + ENERGY EXPENDITURE ENERGY INTAKE The Energy Balance
Metabolic Characteristics of Obese and Pre-obese Individuals • Relative RMR Normal/High Low • Activity EE Cost Normal Low • Fat Oxidation Normal/High Low • SNS activity Normal/High Low • Relative LeptinConcHigh Low Obese Pre/Post Obese Cross sectionnal Prospective
Small Energy Imbalance • 70kg adult • Add or subtract 50 kcal/d • 365 x 50 = 18,250 kcal/y • Assume 1 kg fat = 9,000 kcal Please do not do that. Use dynamic models of Energy Balance: http://bwsimulator.niddk.nih.gov/ (Kevin Hall at NIDDK) http://www.pbrc.edu/research-and-faculty/calculators/weight-loss-predictor/ (Diana Thomas)
Participant Characteristics Age: 36 years (20-56 y old) 4 males, 7 females J ClinEndocrinolMetab. 2012 Apr 24. [Epub
Metabolic adaptation occurred despite lean mass preservation J Clin End Metab. 2012 Apr 24. [Epub Week 6 Week 30 Baseline -244 ± 231 p=0.006 -504 ± 171 p<0.001 Predicted RMR = 1,241 + 19.2 ffm + 1.8 fm – 9.8 age + 405 (male)
Correlation between change in leptin and RMR residual in BL (7 mo) and GB (12 mo) participants Unpublished data
Determinants of the Metabolic Adaptation CR ↓ leptin ↓ SNS ↓ Gonadal axis ↓ Thyroid hormones ↓ Energymetabolism = metabolic adaptation
‘Energy Imbalance Gap’ = the average difference between daily TEI (top line) and TEE (bottom line) needed to produce weight gain over a period of time ‘Energy Flux Gap’= the average difference in energy flux (TEI ≈ TEE) between two points in time Period of weight gain (Settling point A, lower mean weight) (Settling point B, higher mean weight) Energy Gap Terminology Swinburn, et al AJCN, 2009
Some Assumptions • Assumptions • En In = En Out = En Flux at stable weight (‘settling point’) • People are in virtual energy balance because the Energy Imbalance Gap is very small
Total EE in Adults • Usual relationship is displayed with weight as the independent variable • N=1399 adults from 8 centers (6 US, Netherlands, New Zealand) Swinburn, et al AJCN, 2009
Energy Flux and Weight • Reverse the axes • Log the data • β=0.71 • Use some algebra → a 10% difference in En Flux (best thought of as En Intake) → 7% difference in weight (assuming age, gender, height constant) Swinburn, et al AJCN, 2009
D• B • •A • C • E A=base case, B=↑EI, C=↓EI, D=↓PA, E=↑PA Swinburn, et al AJCN, 2009
↓PA Mixture ↑EI Weight increase Is the epidemic due to ↑EI or ↓PA? • The equations could estimate the proportion of the epidemic due to ↓PA or ↑EI or a mixture • NHANES changes in weight for adults and children • USDA calorie ‘disappearance’ data (proportioned for adults and children) Slope Adults 0.71 Children 0.43
Energy Intake 1910-2000 4000 3800 3600 3400 3200 3000 2800 2600 2400 2200 2000 Total Consumption – Uncorrected for waste Energy (kcal/d) Corrected for Waste 1900 1920 1940 1960 1980 2000 Year USDA/ERS Food Review 2002;25:2-15
Estimated changes in daily average energy intake per capita (MJ/d) for US children and adults from the 1970s to the 2000s 500 Kcal/d 354 Kcal/d Estimated Total Energy Intake per capita (MJ/d) Swinburn, Sacks and Ravussin, AJCN, 2009
Relationship Between the “Energy Flux” And Body Weight Mean population weight in 2000s Mean population weight in 1970s Body Weight (Ln kg) Energy Flux = Energy Intake (Ln kJ/d) Swinburn, Sacks and Ravussin, AJCN, 2009
‘Measured’ versus predicted changes Swinburn, Sacks and Ravussin, AJCN, 2009 2000s Weight from NHANES, EnFlux from USDA 1970s 2000s Weight predicted from equations at USDA EnFlux 1970s
Some Consequences • Consequences • Energy Flux Gap is large (~350 – 500 kcal/day over 30 years) • Population needs big changes to reverse to 1970s levels • Match Energy Flux Gap ~350kcal/d in children and ~500kcal/d in adults • This has all to be achieved against the “drivers” of the environment
Conclusions Observed weight gain is virtually all attributable to increased energy intake Reverse energy intake by approximately 500 kcal/d for adults and 350 kcal/d for children Increase physical activity by 110-150 min/d of walking Combination is needed to return to the 1970s
Current Employment Statistics (CES) Current Population Survey (CPS) Church T et al, PLoS One. 2011;6: e19657
Farming Jobs in US Church T et al, PLoS One. 2011;6: e19657
Goods Producing Jobs:Manufacturing, Construction & Mining/Logging Church T et al, PLoS One. 2011;6: e19657
Jobs in U.S. Over Last 50 Years Church T et al, PLoS One. 2011;6: e19657
Service Jobs Church T et al, PLoS One. 2011;6: e19657
Manufacturing vs. Obesity Church T et al, PLoS One. 2011;6: e19657
Physical Activity Intensity Church T et al, PLoS One. 2011;6: e19657
Sedentary & Light to Moderate Intensity Jobs Church T et al, PLoS One. 2011;6: e19657
Mean Occupational Daily METs Church T et al, PLoS One. 2011;6: e19657
Daily Occupational Caloric Expenditure -140 kcal/day -120 kcal/day Church T et al, PLoS One. 2011;6: e19657
Summary • Over the last 50 years…….. • There has been a progressive shift from labor intensive manufacturing jobs to sedentary service related jobs • This has resulted in a loss of …… • 140 kcal/day for men • 120 kcal/day for women • This reduction in work related energy expenditure may explain some of the weight gain in the US population over the past 50 years