Download
1 / 30
300 likes | 446 Views
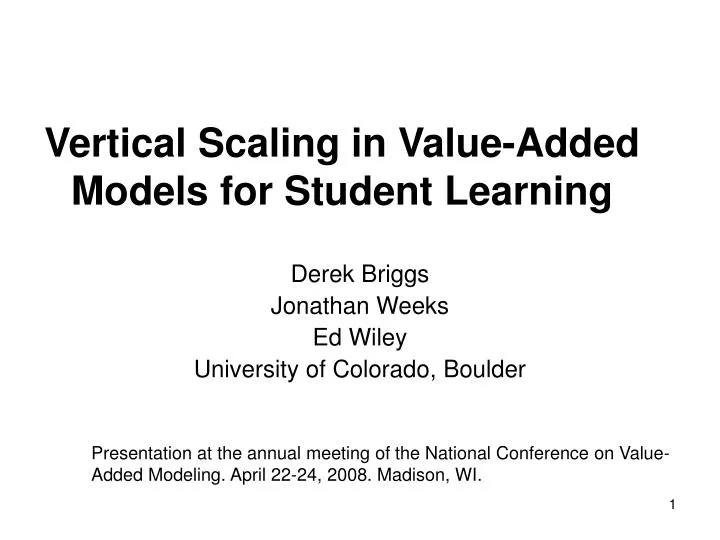
Vertical Scaling in Value-Added Models for Student Learning. Derek Briggs Jonathan Weeks Ed Wiley University of Colorado, Boulder. Presentation at the annual meeting of the National Conference on Value-Added Modeling. April 22-24, 2008. Madison, WI. Overview.

E N D
Vertical Scaling in Value-Added Models for Student Learning Derek Briggs Jonathan Weeks Ed Wiley University of Colorado, Boulder Presentation at the annual meeting of the National Conference on Value-Added Modeling. April 22-24, 2008. Madison, WI.
Overview • Value-added models require some form of longitudinal data. • Implicit assumption that test scores have a consistent interpretation over time. • There are multiple technical decisions to make when creating a vertical score scale. • Do these decisions have a sizeable impact on • student growth projections? • value-added school residuals?
Creating Vertical Scales • Linking Design • Choice of IRT Model • Calibration Approach • Estimating Scale Scores
Data • Outcome measure are Colorado Student Asessment Program (CSAP) test scores in reading. [Items: ~70 MC, 14 CR] • Longitudinal item responses for two cohorts of public and charter school students in the state of Colorado. • Each grade by year cell combination contains roughly 56,000 students. 1,379 unique schools. • Race/Ethnicity of Students: 64% White, 26% Hispanic, 6.3% Black
Linking Design Note: No common linking items were available between 2006 and 2007. • (MC items, CR items) Unique Items • (MC items, CR items) Common Items
Creating a Vertical Scale Technical Decisions Psychometricians Make • Estimation • EAP • ML • IRT Model • 1PLM/PCM • 3PLM/GPCM • Calibration • Separate • Concurrent 8 Defensible Vertical Scales • se1 • sm1 • se3 • sm3 • ce1 • cm1 • ce3 • cm3
Item Response Theory Models The eqn above it the 3 Parameter Logistic (3PL) IRT model for binary test items. The 1PL model results from imposing the constraints Reasons for choosing particular IRT model specification: statistical, pragmatic, philosophical.
IRT Assumptions and Properties Assumptions • Unidimensionality: The test only measures one latent construct. • Local Independence: Conditional on this latent construct, item responses are independent. Properties • Scale Indeterminacy: The scale of a test is only identified up to a linear transformation. • Parameter Invariance: If the model fits, item & person parameters should be the same regardless of the group of persons & items used to estimate them.
Separate Calibration • Item and person parameters are estimated separately for each grade by year combination. • A linear transformation is used to place the parameters from one test—the “From” scale—onto the scale of the other—the “To” scale. • Ability Estimates • Item Parameters A and B represent “linking constants”
Estimating Linking Constants • Stocking & Lord Approach • Compute for a test characteristic curve for each test as the sum of item characteristic curves. • Sum the squared differences between the curves. • Find the linking constants A and B that minimizes the criterion in 2. “To” “From”
Separate Calibration w/ CO Data Each oval represents a the linking of two separate item calibrations using the Stocking & Lord approach.
Concurrent Calibration 20 Unique 2003 Items 20 Unique 2004 Items 10 Common Items 50 Total Unique Items 20 10 Grade 4 2003 10 20 Grade 4 2004 The item parameters from multiple groups of test-takers are estimated simultaneously
Hybrid Calibration w/ CO Data • Each oval represents a the linking of two separate item calibrations using the Stocking & Lord ICC approach. • Each rectangle represents the concurrent, multigroup calibration of the same grade level across two years.
Estimating Student Scale Scores In IRT estimation of student-level scale scores happens after item parameters have been estimated. Two key options: • Maximum Likelihood estimates (ML) • Expected a Posteriori estimates (EAP) • Tradeoffs: • ML estimates are asympotically unbiased. • EAP estimates minimize measurement error.
Value-Added Models • Parametric Growth (HLM) • Non-Parametric Growth (Layered Model)
Parametric Growth Model • Linear Mixed Effects Model (3 Level HLM) • Given 3 years of test score data for a student (grades 3-5), project a scale score 3 years later (grade 8) [Model proposed by OR, HI] • Score projection is a function of • two fixed effects (intercept & slope) • two student level random effects (level 2 intercept & slope) • two school level random effects (level 3 intercept & slope)
Fixed Effect Estimates Note: Scale Score Outcome is in Logit Units, Base Year = Grade 3
Comparing Growth Projections 3PLM/GPCM &Separate 3PLM/GPCM & Hybrid 1PLM/PCM Note: Projection lines based solely on fixed effect estimates Grade 3 Grade 8
Correlations of Student and School Slope Estimates by Vertical Scale
Empircal Bayes Estimates of School-Level Growth r = .96 • Standard Approach in Colorado: • Separate • 3PLM/GPCM • EAP Switch to Hybrid calibration
Empircal Bayes Estimates of School-Level Growth r = .88 • Standard Approach in Colorado: • Separate • 3PLM/GPCM • EAP Switch to Hybrid calibration & 1PLM/GPCM
Empircal Bayes Estimates of School-Level Growth r = .75 • Standard Approach in Colorado: • Separate • 3PLM/GPCM • EAP Switch to Hybrid calibration,1PLM/GPCM, MLE
Layered Model Value-Added Parameters of Interest: Notes: Model above assumes complete persistence. Bayesian estimation using non-informative priors.
Conclusion • Vertical scales have (largely) arbitrary metrics. • Absolute interpretations of parametric growth can deceive. • Students might appear to grow “faster” solely because of the scaling approach. • Can criterion-referencing (i.e., standard-setting) reliably take this into account? • A better approach might focus on changes in norm-referenced interpretations (but this conflicts with the NCLB perspective on growth). • The layered model was less sensitive to the choice of scale, but there are still some noteworthy differences in numbers of schools identified.
Future Directions • Full concurrent calibration. • Running analysis with math tests. • Joint analysis with math and reading tests. • Acquiring full panel data. • Developing a multidimensional vertical scale. derek.briggs@colorado.edu