Download
1 / 3
30 likes | 76 Views
Making Histograms with the TI-83 Plus. Procedure Reference: http://www.geocities.com/calculatorhelp/ti83graphs.htm. Entering data: one variable. Press . Press (you should see 1:Edit on the screen).

E N D
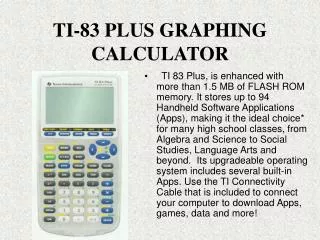
Making Histograms with the TI-83 Plus Procedure Reference: http://www.geocities.com/calculatorhelp/ti83graphs.htm
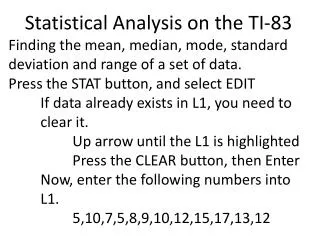
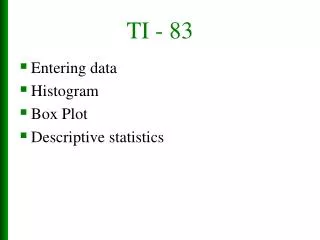
Entering data: one variable • Press . • Press (you should see 1:Edit on the screen). • You should see 3 columns: L1, L2, L3. The cursor should be at L1 (if not, arrow over to it). • Type in the first number, then • Type in the second number, then . • Continue until finished.
Drawing the Histogram • Press (It says STAT PLOT above the key.) . • The cursor is on ON. • Press . • Press to get the cursor on the graph that looks like this: • This is the one we want, so press . • If your data is in L1, then you can just press the GRAPH key (top row, 5th key). • Otherwise, press and select your list (press followed by the key with your list number). Now press the GRAPH key.