Download
1 / 46
460 likes | 643 Views
Contrast Echocardiography. Amit J. Thosani, MD Clinical Fellow, Division of Cardiology 23 January 2008. Applications of Contrast Echocardiography. Detection of intracardiac shunts: Patent foramen ovale Atrial septal defect Intrapulmonary shunt

E N D
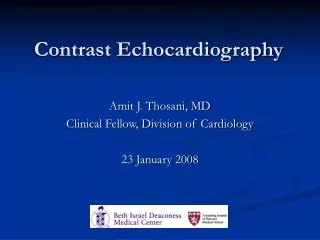
Contrast Echocardiography Amit J. Thosani, MD Clinical Fellow, Division of Cardiology 23 January 2008
Applications of Contrast Echocardiography • Detection of intracardiac shunts: Patent foramen ovale Atrial septal defect • Intrapulmonary shunt • Left ventricular opacification/endocardial border definition • Assessment of myocardial perfusion
Agitated saline Bubble diameter is greater than diameter of pulmonary capillaries No transpulmonary passage (in absence of intrapulmonary shunt) PFO/ASD/Persistent Left Superior Vena Cava Microbubble diameter of 1-5 µm Able to traverse pulmonary capillary bed Resonate at frequency of 1.5-7 MHz, corresponding to clinical transducer frequencies Right vs. Left Heart Contrast
Physical Principles • Blood appears black on conventional 2D echocardiography because of weak ultrasound scatter by RBCs at conventional imaging frequencies • Contrast ultrasound is based on scattering of incident ultrasound at gas/liquid interface • Results in increased strength of return signal
Physical Principles • Ultrasound generates positive and negative (sinusoidal) pressures • Microbubbles undergo compression at peak of ultrasound wave and expansion at nadir • Bubble radius may change by a factor of 20 or more • Sound is generated with this movement, and amplified in combination of movement of thousands of microbubbles • Contrast bubbles oscillating in an ultrasound field are vastly more effective than RBCs at scattering sounds, resulting in improved blood pool signal • This generated signal can be distinguished from that of other tissue, resulting in improved imaging capabilities
Resonance and Harmonics • Resonance: a physical property of gas bubbles; an optimal frequency of oscillation at which ultrasound absorption and scatter is most efficient • Insonation of gas bubbles at their resonant frequency (fr) results in non-linear oscillation • Alternate expansion and contraction of the bubble are unequal • Results in generation of harmonics: ultrasound is produced at a frequency equal to an integer multiple of the isonating (fundamental) frequency
Harmonics • f=velocity/wavelength • Wavelength (λ)=2L/n, n=# of harmonic • Fundamental f1=v/2L • Second harmonic f2=2v/2L=2f1 • Third harmonic f3=3v/2L=3f1
Harmonic Imaging • Microbubbles isonated with ultrasound frequency f1 return signals of the second harmonic frequency (f2=2f1) and the fundamental frequency f1 • Harmonic imaging: receiver is tuned to receive double the transmitted frequency • Harmonic imaging results in greatly improved signal-to-noise ratio; improves sensitivity to contrast • Enables excellent LV cavity opacification • Improved myocardial tissue imaging
Acoustic Properties of Microbubbles Lindner JR. Microbubles in medical imaging: current applications and future directions. Nat Rev Drug Discov. 2004 Jun;3(6):527-32.
Mechanical Index • Second harmonic imaging signals increase with increasing ultrasound power • Microbubbles are deformed by higher ultrasound power to point of destruction • Mechanical Index (MI)=Acoustic Power/√f0 • Low mechanical index (0.4 to 0.5) harmonic imaging is used to enhance LV endocardial border definition • MI>0.7 is associated with bubble destruction
LV Cavity Opacification Kitzman DW, Goldman ME, Gilliam LD, Cohen JL, Aurigemma GP, Gottdiener JS. Efficacy and safety of the novel ultrasound contrast agent perflutren (definity) in patients with suboptimal baseline left ventricular echocardiographic images. Am J Cardiol. 2000 Sep 15;86(6):669-74.
Albunex • Air-filled sonicated albumin microbubbles (MBI, San Diego, California) • 1994: First ultrasound contrast agent approved for use in US • Albumin shell designed to prevent outward diffusion of air from microbubbles • Substantial loss of gas volume occurred during transit to systemic circulation following intravenous injection • Markedly decreased contrast enhancement and short duration of clinically useful contrast
Innovations in Microbubble Agents • Newer agents designed to improve intravascular stability • Modifications in shell and gas content • “Air-tight” polymer shells or lipid-galactose stabilized shells designed to minimize outward diffusion of gas • Use of gases less prone to outward diffusion than air • Inert high-molecular-mass gases with low diffusion coefficients and low solubility in water (low Ostwald coefficient); result in prolonged lifespan of microbubbles
OptisonTM • Perflutren Protein-Type A Injectable Microspheres • GE Healthcare, Buckinhamshire, United Kingdom • Octafluoropropane • Manufacturer has voluntarily suspended marketing since 2005 Structural Formula Optison with red blood cells http://www.amershamhealth-us.com/optison/monograph/om03-02.html
Definity • FDA approval in 2001 • Bristol-Myers Squibb Medical Imaging, Billerica, MA • $65 million in sales in 2006 • More than 2 million patients dosed
Left Ventricular Cavity Opacification: Utility and Applications
Utility of LV Opacification • Improved imaging and analysis of: LV volume Regional wall motion Intracardiac mass/thrombus Pseudoaneurysm Apical or mid-cavity hypertrophic cardiomyopathy
CMR vs. Contrast Echo for LVEF and LV Volume Assessment • 40 patients referred for routine echocardiography • MRI performed (1.5 T, Apical 2, 4; Short axis apexbase) • Followed immediately by TTE, once without and once with 2% dodecafluoropentane (EchoGen) • Blinded interpretation of data Hundley WG, Kizilbash AM, Afridi I, Franco F, Peshock RM, Grayburn PA. Administration of an intravenous perfluorocarbon contrast agent improves echocardiographic determination of left ventricular volumes and ejection fraction: comparison with cine magnetic resonance imaging. J Am Coll Cardiol 1998; 32(5): 1426-32.
CMR vs. Contrast Echocardiography for LVEF Assessment Bland–Altman plots showing the mean difference (solid lines) and the limits of agreement (dashed lines) between echocardiographic and MRI measurements of LVEF. Left = baseline echocardiography; right = post contrast echocardiography. The value for each patient is represented by a diamond. The limits of agreement become more narrow after contrast agent administration. Hundley WG, et al. J Am Coll Cardiol 1998; 32(5): 1426-32.
Improvement in LVEF Classification • Open Bars=Standard Echocardiography • Solid Bars=Contrast Echocardiography • In subjects with complete visualization of the endocardium, contrast agent administration was of no benefit. • If ≥2 endocardial segments were not visualized at baseline, contrast enhancement markedly improved classification of EF subsets. Hundley WG, et al. J Am Coll Cardiol 1998; 32(5): 1426-32.
Intracardiac Mass vs. Thrombus • Contrast echocardiography has been helpful in distinguishing between intracardiac thrombus or mass • Presence or absence of vascularity within a mass helps determine tumor vs. thrombus • 16 patients with intracardiac masses referred for echocardiography • Slow intravenous push (0.6 to 1.0 ml) of Optison or continuous intravenous infusion (infusion rate adjusted for optimal enhancement) of Definity • Masses imaged using gray-scale power modulation (SONOS 5500, Philips Medical Systems, Andover, Massachusetts) with a low mechanical index (0.1) • Whenever a mass demonstrated perfusion with echocardiographic contrast, an ultrasound impulse of high mechanical index (1.0 to 1.6) was transmitted for four up to 10 frames to destroy microbubbles within the mass • This prevented the recording of "false-positive perfusion" due to a saturation artifact secondary to high gain settings • Perfusion of the mass was then confirmed by visualizing gradual contrast replenishment of the mass after the high-mechanical index impulse. • Contrast enhancement assessed visually and with dedicated software (Qlab, Phillips Medical Systems) Kirkpatrick JN, Wong T, Bednarz JE, et al. Differential diagnosis of cardiac masses using contrast echocardiographic perfusion imaging. J Am Coll Cardiol 2004; 43: 1412-1419.
Intracardiac Mass vs. Thrombus (A) A mass filling the right atrium (apical five-chamber view). (B) The mass hyper-enhanced with echocardiographic contrast, compared with the adjacent myocardium. (C) There was no enhancement of the mass or the adjacent myocardium after a high-mechanical index impulse destroyed contrast bubbles, ruling out "false-positive perfusion" of the mass. (D) The biopsy specimen diagnosis was follicular thyroid carcinoma. The blood vessels are stained with CD31 antibody. (E) Perfusion curves of video intensity over time demonstrated greater values for A and ß for the mass than for the adjacent myocardium. Kirkpatrick JN, et al. JACC 2004.
Intracardiac Mass vs. Thrombus (A) A left ventricular apical mass (apical four-chamber view). (B) The mass showed no enhancement with contrast, whereas the adjacent myocardium demonstrated enhancement. (C) There was no enhancement of the mass or adjacent myocardium after a high-mechanical index impulse destroyed the contrast agent. (D) The surgical specimen demonstrated no staining with CD34 antibody and minimal cellularity, consistent with thrombus. (E) Perfusion curves of video intensity over time demonstrated no increase in video intensity in the mass from baseline, whereas video intensity increased within the myocardium. Kirkpatrick JN, et al. JACC 2004.
Assessment of Midcavitary Hypertrophic Cardiomyopathy
Apical Hypertrophic Cardiomyopathy Soman P, Swinburn J, Callister M, Stephens NG, Senior R. Apical hypertrophic cardiomyopathy: bedside diagnosis by intravenous contrast echocardiography. J Am Soc Echocardiogr 2001; 14(4): 311-3.
Myocardial Contrast Echocardiography (MCE) • Ultrasound with high mechanical index (>1.5) destroys microbubbles • Myocardium with normal perfusion is enhanced by microbubbles within 5-7 cardiac cycles • Normal myocardium appears opacified • Areas of decreased perfusion appear dark or patchy • Contrast echocardiography allows for real time imaging of perfusion and contractility Lepper W, Belcik T, Wei K, et al. Myocardial contrast echocardiography. Circulation 2004; 109(25): 3132-5.
MCE vs. SPECT for CAD Detection • Prospective, multicenter study of 123 pts referred for cardiac catheterization for known or suspected CAD • Rest and vasodilator stress SPECT performed on separate days • MCE studies performed concurrently with stress SPECT • Dipyridamole infused at 0.56 mg/kg for four min and, if tolerated, a further 0.28 mg/kg was infused for two min • After two min, radiotracer injection (600 MBq of 99mTc-sestamibi) was followed by contrast administration (Sonazoid) • Stress MCE images were obtained (apical 2, 3, 4; MI 0.5 followed by pulse of MI 1.0) • Patients underwent coronary arteriography within four weeks of noninvasive imaging • All images analyzed by observers independently of clinical or other imaging data. Jeetley P, Hickman M, Kamp O, et al. Myocardial contrast echocardiography for the detection of coronary artery stenosis: a prospective multicenter study in comparison with single-photon emission computed tomography. J Am Coll Cardiol. 2006 Jan 3;47(1):141-5.
Image Assessment • 16-segment left ventricular model was used together with a three-point semi-quantitative scale for both MCE and SPECT • Any myocardial segment with normal contrast replenishment at rest that did not fill in one to two seconds after dipyridamole was considered to demonstrate a reversible MCE perfusion defect • On SPECT, if the degree of tracer uptake was reduced at stress compared with that seen at rest, a reversible defect was diagnosed • A perfusion defect at rest that remained unchanged at stress was considered to be a fixed defect • The presence of a defect in 1 myocardial segment(s) was taken to indicate the presence of CAD • Myocardial contrast echocardiography was analyzed blinded to the wall thickening data. Jeetley P, et al. JACC 2006
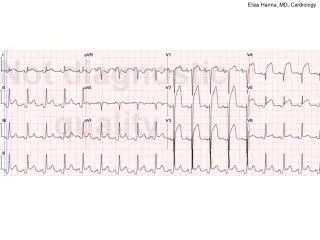
Myocardial Contrast Echocardiography (MCE) Reversible perfusion defects (arrows) in the posterior wall, apex, and septum in a patient with multivessel disease (bottom). The top panel shows the corresponding resting study demonstrating normal perfusion. Jeetley P, et al. JACC 2006
MCE vs. SPECT for CAD Detection All Coronary Distributions Open Bar=SPECT Solid Bar=MCE Anterior Circulation Posterior Circulation Jeetley P, et al. JACC 2006.
FDA “Black Box” Warning • Issued on October 10, 2007 • Post-marketing reports of 11 deaths 1-12 hours following administration of perflutren-based contrast agents • 10 patient deaths following Definity injection and 1 death following Optison injection • 4 patient deaths temporally related to contrast injection • Perflutren-based compounds contraindicated for use in patients with: 1. Acute coronary syndromes 2. Acute myocardial infarction 3. Worsening or clinically unstable heart failure http://www.fda.gov/cder/drug/InfoSheets/HCP/microbubbleHCP.htm
Definity Safety Data • Kitzman DW, Goldman ME, Gilliam LD, Cohen JL, Aurigemma GP, Gottdiener JS. Efficacy and safety of the novel ultrasound contrast agent perflutren (definity) in patients with suboptimal baseline left ventricular echocardiographic images. Am J Cardiol. 2000 Sep 15;86(6):669-74. • Patients referred for echocardiogram with suboptimal views • Definition: endocardial borders not visible in ≥ 2 of 6 segments in either apical 4- or 2-chamber view • 211 patients randomized in 2:2:1 scheme to 5 uL/kg perflutren dose (85 pts), 10 uL/kg (84 pts), or saline placebo (42 pts) • Safety assessed by evaluation of adverse events, clinical laboratory tests (serum chemistry, hematology, and urinalysis, electrocardiograms), vital signs, and physical examinations • Information obtained before the perflutren or placebo injections and 24, 48, and 72 hours after administration.
Safety Data Kitzman DW, Goldman ME, Gilliam LD, Cohen JL, Aurigemma GP, Gottdiener JS. Efficacy and safety of the novel ultrasound contrast agent perflutren (definity) in patients with suboptimal baseline left ventricular echocardiographic images. Am J Cardiol. 2000 Sep 15;86(6):669-74.
Safety Data • No clinically significant change in physical examination, vital signs, electrocardiographic tracings, or chemistry or hematology laboratory values • Adverse event rates similar across treatment groups • 30 of 169 patients (18%) in the combined perflutren-treated group (15% in the 5 ml/kg group and 20% in the 10 ml/kg group) • 6 of 42 placebo-treated patients (14%) • Headache was most frequently reported adverse event (9 of 169 patients who received perflutren (5%) and 3 of 42 patients who received placebo (7%) Kitzman DW, Goldman ME, Gilliam LD, Cohen JL, Aurigemma GP, Gottdiener JS. Efficacy and safety of the novel ultrasound contrast agent perflutren (definity) in patients with suboptimal baseline left ventricular echocardiographic images. Am J Cardiol. 2000 Sep 15;86(6):669-74.
Safety Data • 77 of 211 patients had COPD or CHF • 62 patients with CHF: 17 NYHA Class I 28 NYHA Class II 11 NYHA Class III 1 NYHA Class IV 5 classified as unknown • 15 patients with COPD: 12 with mild disease 2 with moderate disease 1 with severe disease • These patients may be at increased risk of adverse events because of impaired cardiopulmonary reserve • Adverse event profiles in these disease subgroups were similar to the overall group, were not clinically significant, and were not different from placebo. Kitzman DW, Goldman ME, Gilliam LD, Cohen JL, Aurigemma GP, Gottdiener JS. Efficacy and safety of the novel ultrasound contrast agent perflutren (definity) in patients with suboptimal baseline left ventricular echocardiographic images. Am J Cardiol. 2000 Sep 15;86(6):669-74.
Additional Safety Data • Dose ranging studies showed no changes in systemic or pulmonary hemodynamics, myocardial contractility, regional myocardial blood flow, even after 30 injections capable of myocardial opacification over 10 minutes • No cellular uptake or mitochondrial metabolism • Fluorocarbon gases are insoluble in blood, biologically inert, and excreted by the lungs within minutes • Large scale Phase III studies involving > 1700 patients revealed no safety concerns Skyba DM, Camarano G, Goodman NC, Price RJ, Skalack TC, Kaul S. Hemodynamic characteristics, myocardial kinetics, and microvascular rheology of FS-069, a second generation echocardiographic contrast agent capable of producing myocardial opacification from a venous injection. J Am Coll Cardiol 1996; 28: 1292-300. Cohen JL, Cheirif J, Segar DS, et al. Improved left ventricular endocardial border delineation and opacification with OPTISON (FS069), a new echocardiographic contrast agent. Results of a phase III Multicenter Trial. J Am Coll Cardiol 1998; 32: 746-52.
Definity Related Deaths • Patient 1: Infarct related cardiomyopathy Cardiac arrest 1 minute into exercise stress test Received Definity injection 30 min prior • Patient 2: Elderly patient in CCU Recent MI, Severe LV systolic dysfunction Cardiac arrest shortly after contrast echocardiography
Definity Related Deaths • Patient 3: 70 y man, CABG, CHF, DVT Contrast echocardiogram in setting of worsening heart failure Sudden cyanosis, hypotension, and death 5 minutes after completion of study Massive PE reported as likely cause of death
Definity Related Deaths • Patient 4: 35 y old morbidly obese woman with PPCM Admitted to ICU with multilobar pneumonia Mechanical ventilation and multiple pressors Cardiac arrest immediately after Definity injection Post mortem: RV thrombus and multiple pulmonary emboli
“Pseudocomplication” • Main ML, Goldman JH, and Grayburn PA. Thinking outside the “Box”—the ultrasound contrast controversy. J Am Coll Cardiol 2007; 50 (25): 2434-2437. • Complications occurring after a medical procedure may be due to either the procedure itself or due to progression of the underlying disease state • Major cardiovascular events are more likely to occur in patients who are “ill enough” to require diagnostic testing • Echocardiography often the test of choice (or the only test available) for critically ill patients (shock, hypotension, tamponade, etc.) • Association of adverse events following contrast administration does not establish causality