Download
1 / 42
420 likes | 589 Views
Comparison of Solution Verification Techniques. V. Gregory Weirs, William J. Rider, James R. Kamm Sandia National Laboratories, Albuquerque , NM July 24, 2013 *Los Alamos National Laboratory after August 5 th 2013. SAND 2013-6079C. Acknowledgements.

E N D
Comparison of Solution Verification Techniques V. Gregory Weirs, William J. Rider, James R. Kamm Sandia National Laboratories, Albuquerque, NM July 24, 2013 *Los Alamos National Laboratory after August 5th 2013 SAND 2013-6079C
Acknowledgements Idea of solution verification (also called calculation verification): Pat Roache, “Verification and Validation in Computational Science and Engineering,” 1998. An excellent book, incorporating more than a decade of V&V theory development advanced by significant DOE ASC program funding: Bill Oberkampfand Chris Roy , “Verification and Validation in Scientific Computing,” 2010. The canon. Recent work in this talk was developed by Bill Rider, Walt Witkowski, Jim Kamm, and Yakov Ben-Haim.
Outline Context and motivation Code Verification – the theory of numerical error Solution Verification– what it is and what is not The Grid Convergence Index (GCI) The Robust Multi-Regression (RMR) approach The Info-Gap Theory
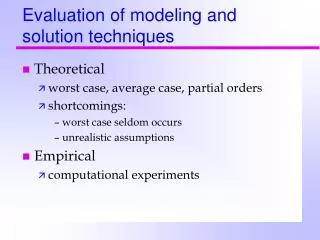
More is Being Asked of Modeling and Simulation Our focus is on engineering and scientific simulations that support decisions of consequence Decisions of consequence: As a result of the decision, significant money will be spent, lives may be placed at risk Simulations provide information that either can not be obtained or is too expensive to obtain in another way Decision maker will not have deep knowledge of the application, and might not have a technical background This context simply reflects the increasing maturity of modeling and simulation
Predictive Modeling and Simulation Require Quantified Uncertainties • Numerical simulations provide approximate solutions to models of reality • Validation addresses the sufficiency of a model for a specific application or intended use • Verification addresses numerical error and method correctness, which arises from the approximate solution techniques employed by FEM and other discretization techniques (FDM, FVM, …) • Uncertainty quantification addresses variability in simulation results due to uncertainty in modeling (often accessed via input parameters, or model selection) • UQ should include numerical uncertainty computed via verification
Quite often comparisons are done using the “viewgraph” norm These plots are merely notional schematics that illustrate where we want to go. Exp. Data Best calculation Credit: Rider SAND2013-2059C
Solutions are often described as “converged” as a subjective opinion This is “mesh sensitivity”. This is not solution verification! Fine Medium Exp. Data ± Error Best calculation Credit: Rider SAND2013-2059C
Solution Verification for Convergence: the numerical error decreases with finer mesh resolution Fine Medium Coarse With a third resolution convergence can be assessed. These results are is NOT converged, assuming mesh doubling (0th order). A poor man’s method of solution verification: (where mesh doubling is used…) • Equally spaced lines implies zeroth order • Factor of two decrease implies first order • Factor of four decrease implies second order This is solution verification, despite the negative results Credit: Rider SAND2013-2059C
Convergence: the numerical error decreases with finer mesh resolution These results are converging (~1st order). Distance between the curves is halved with refinement. Fine Medium Coarse Exp. Data ± Error Best calculation It is absolutely essential that the quantity “Q” be something that can reasonably be expected to converge numerically. Credit: Rider SAND2013-2059C
In an ideal world you could extrapolate the solution to h=0. With three grids a convergence rate and a converged solution can estimated. Fine Medium Coarse Extrapolated Exp. Data ± Error Best calculation “Ideal world” means you have high confidence in the estimateof the observed error. Credit: Rider SAND2013-2059C
For practical calculations, use the solutions to estimate numerical error Fine Medium Coarse Extrapolated Exp. Data ± Error Best calculation Credit: Rider SAND2013-2059C
Error estimates are useful evenwhen the solutions are not converging Fine Medium Coarse We want to produce justifiable estimates even in “bad” cases! Credit: Rider SAND2013-2059C
This Talk Is About the Practical Estimation of Numerical Error For real-world problems simulations are often: not smooth – singular, cusps, shocks, material discontinuities multiphysics multiscale not robust - code might crash limited by resources - small number of simulations, especially for fine meshes not in the asymptotic range difficult to analyze – it might be difficult to quantitatively relate quantities of interest (QOIs) to the solution
The Cook-Cabot Problem • Compressible 1D Euler equations • Periodic BCs • Wave is nearly acoustic • Very low Mach number (< 0.05) Exact solution • Initially smooth • Based on Burgers’ equation • Exact solution until shock formation density velocity t=0.0e-5 t=0.5e-5 t=1.0e-5 t=1.5e-5 t=2.0e-5 Reference: Cook, A. W. and Cabot, W. H., J. Comp. Phys. 195, 2004.
The Sod Problem Riemann problems are the canonical shock physics IVP, with two constant initial states. • The Sod “shock tube” problem is a very mildtest, but has a discontinuous exact solution • The Riemann problem for gas dynamics has three canonical waves: RarefactionContact Shock IC IC IC SIE Velocity Density Pressure IC Position Position Position Position Reference: Sod, G. A., J. Comp. Phys. 27:1-31, 1978. Credit: Kamm, Rider, Weirs, Love, SAND2011-7601C
ALEGRA is used to compute solutions Today’s results: just hydrodynamics: • Lagrange + Remap; has demonstrated second order accuracy in time and space for smooth solutions, however, for this work first order algorithms were used • Artificial viscosity for shock capturing - can interfere with design order of accuracy • (Passive) tracer particles provide diagnostics; but might not have the same error behavior as the field solution Developed by SNL under the DOE ASC program Designed for: ideal and resistive MHD, shock physics, solid dynamics; lots of material models Applications: Z-pinchs, hypervelocity impact, shaped-charge jets, high explosives
Code Verification We have theory and analysis that show our numerical method has certain properties if certain assumptions are met Code verification is the process for testing whether or not an implementation of the method (i.e., the code) delivers these properties Requires exact solutions of the governing equations Used to find bugs Used to learn more about the numerical method The convergence rate is the most commonly tested property, used as the primary fiducial, and the most important
Truncation error has a power law dependence on the mesh spacing Coefficient Convergence rate Exact solution, i.e., h 0 Characteristic length scale of mesh cell, “∆x” Computed solution on grid of mesh size h Code Verification: Given eh, h, Find A, p • Almost all mesh-based discretizations reduce to this error ansatz under broadly similar assumptions: • h is “small enough”: asymptotic regime • Uniform mesh refinement • Convergence rate depends on the smoothness of the solution • The details do matter, and numerical analysis of a particular method provides these details The standard power-law form for the error is: Credit: Kamm, Witkowski, Rider, Trucano, Ben-Haim , SAND2012-7798C
Asymptotic convergence is the fundamental concept Domain of asymptotic convergence, where the truncation error dominates Domain where the discretization is not adequate to solve the continuous equations 10+1 10+0 10-1 10-2 10-3 10-4 … 10-15 10-16 Domain where round-off errors start to accumulate log ||ycontinuous–y(Δx)|| N O T I O N A L Slope = -1 “Stagnation” This is typically where one wishes to run an analysis code. Slope = -½ log(Δx) 0 10-7 10-6 10-5 10-4 10-3 10-2 10-1 • PDEs are discretized in space Δx, time Δt, etc., for resolution using finite-digit arithmetic. Credit: F. Hemez “As we refine the grid we hope to get better approximations to the true solution.”Randy LeVeque, Computational Methods for Astrophysical Fluid Flow Credit: F. Hemez (LANL)
Cook-Cabot Code Verification L1 norm of density error • Line has many more points than the table, especially for low resolution • Relatively smooth (see low resolution points)
Sod Code Verification Results L1 norm of density error • NX = 10, 15, 20, …, 5000 • Noisy; common for discontinuous solutions • Point-wise, noisy rates, but convergence globally Simulations used default settings in ALEGRA; observe p~1 (globally, not point-wise) with minor adjustments
Sod Code Verification Results L1norms of density error Rarefaction: Contact: Shock: Different waves have different convergence rates*; eventually, the contact error will dominate the error (in theory) Greg has post-conference homework! *Reference: Banks, Aslam, Rider, J. Comp. Phys. 227 (2008)
Solution Verification Informal definition of solution verification: Numerical error estimation based on a sequence of simulations at different mesh resolutions Key features: Non-intrusive – apply to existing codes Relatively inexpensive Applies to solution and functionals, under appropriate assumptions Other error estimation techniques (not discussed here) Error transport equation Approaches using the dual problem or adjoints A posteriori error estimation
Code Verification vs. SolutionVerification Code Verification: • You have an exact solution, so you compute exact errors • You are testing your code (implementation, algorithm) • Hard estimates of convergence properties • Metrics are defined by numerical analysis Solution Verification: • You don’t have an exact solution, you estimate numerical errors • You test your solution(s) • Softestimates of numerical error • Metrics are defined by the analyst – integrated quantities, point values, functionals of the solution
Richardson Extrapolation estimated value three equations three unknowns observed rate prefactor Solution Verification: Given uh, h, Estimate • Constant refinement ratio: • Non-constant refinement ratios: no closed form solution; solve iteratively for • More than three meshes: overdetermined system Oberkampf and Roy (2010), following Roache:
Estimate numerical uncertaintyusing the Grid Convergence Index log (u) hf hm hc log (h ) • The standard power error ansatzgives an estimate of numerical error, : coarse medium fine • For three or more calculations, pis calculated and the uncertainty is estimated with a “safety factor”: with • This result is claimed to give a “95% confidence interval.” • This claim is based on many years of experience with simulations. • For two calculations, no estimate for is possible — and the estimated uncertainty is greater: with Credit: Kamm, Witkowski, Rider, Trucano, Ben-Haim , SAND2012-7798C
Cook Cabot results using the GCI Position of Lagrangian tracer x0 = 0.25 • Computed convergence rates suggest extrapolation is not reliable • Sequences: coarse vs. asymptotic regime, clustered vs. doubling Exact value =
Cook Cabot results using the GCI Density at x = 0.25 • Convergence rates again suggest large uncertainties • Two uncertainty estimates are lower than the true error Exact value = 1.08223855
Sod results using the GCI density velocity Exact value: x= 0.732558 Position of Lagrangian tracer x0 = 0.60 Computed convergence rates suggest extrapolation is not reliable One uncertainty estimate is lower than the true error
Sod results using the GCI Density at x = 0.45 • Convergence rates again suggest large uncertainties • One uncertainty estimate is lower than the true error Exact value = 0.4942758
Why verification analyses cango so very, very wrong. The data in this study is poorly conditioned: the grids are too close in resolution, and far from the asymptotic range. Such poor conditioning produces unreliable solutions. The super-high convergence rate is not ruled out, but could be. The use of constraints on the solutionfor the convergence rate have the benefit of avoiding such absurd outcomes. Once constraints are added to the problem, the solution no longer is unique. The norm that is minimized to obtain the solution changes the solution significantly. Introducing these changes across a set of norms gives a diversity of results that requires a rethink of how such analysis is conducted. Credit: Rider, Kamm, Witkowski, Ben-Haim , SAND2013-2059C
Regression, norms and probability distributions Gaussian PDF L1 Regression Laplace PDF LinfRegression UniformPDF Use robust statistics not standard statistics • Remember, both the data and the regression can produce outliers. • Minimization of the residual for regression carries implications about optimality. The fit is optimal if the errors are distributed: • Gaussian implies L2 , the standard approach (unweighted) • Laplace (double exponential) implies L1 (absolute value) • Uniform implies Linfinity (maximum) • Regression can be done in any norm if the data is either under- or over-determined and can include constraints as well. • Usual statistics are highly susceptible to outliers, but median statistics are not. Credit: Rider, Kamm, Witkowski, Ben-Haim , SAND2013-2059C
Robust multi-regression method: robust statistics plus expert knowledge The standard method is fragile and includes implicit assumptions regarding statistics, error and convergence, these assumptions are not included in the analysis. A structured, principled way to introduce specific expert knowledge. Bounds on extrapolated solution could be used, too (such as, e.g., positivity). Produce a set of estimates with explicitly defined assumptions about statistics of the error; this set of estimates is free of the fragility of a single estimate. Apply robust statistical techniques to produce results with quantified confidence. Run over subsets of data (jackknife). Produce a bounding estimate using the same approach. Useful when the data is non-monotonic. Verification uses (nonlinear) regression to compute everything. Typically, a standard least squares fit to the data is used. Assumptions are usually not stated, nor necessarily appropriate. We apply the following algorithm to the data (2 or more grids): Define the theoretical convergence rate, pth, with lower (pL) and upper (pU) bounds on the expected convergence rate. Solve the regression problem in multiple norms ranging from L1 to Linfinitywith the p constrained to be in[pL,pU]. Also solve the linear regression where the convergence rates are defined as pth, pLand pU. From the set of and p select the median values and the median deviation for each: Solve for the absolute error in the same manner to obtain: Credit: Rider, Kamm, Witkowski, Ben-Haim , SAND2013-2059C
Cook Cabot results using RMR Position of Lagrangian tracer x0 = 0.25 Exact value = Rates more reasonable Uncertainty estimates smaller than those for GCI RMR provides uncertainty estimate for the rate
Cook Cabot results using RMR Density at x = 0.25 • True errors less than GCI in four cases • Uncertainty estimates larger than GCI in four cases • Estimate lower than error in one case Exact value = 1.08223855
Sod results using RMR density velocity Exact value: x= 0.732558 Position of Lagrangian tracer x0 = 0.60 True errors less than for GCI, except one case Uncertainty usually less than GCI Two uncertainty estimates are lower than the true error
Sod results using RMR Density at x = 0.45 • True errors less than GCI in half the cases • Uncertainties less than GCI in half the cases • Uncertainty bounds error Exact value = 0.4942758
RMR models for Sod density, x=0.45 • Points are clustered • Fits are ill-conditioned • Large spread as h->0 Sequence: u80=0.4894 u90=0.499668 u100=0.508325 u110=0.498542 RMR estimate: u=0.499523 Exact value: u=0.49427581
Info-Gap Approach toSolution Verification • More info: http://info-gap.com • An “info‐gap” is a disparity between: (1) what is known and (2) what needs to be known in order to make a decision of interest. • Info‐gap analysis is a non-probabilistic approach to UQ that offers a method for supporting model-based decisions under severe uncertainty. • The emphasis is on decision support, not on “get the/an answer.” • An info-gap model provides a weaker characterization of uncertainty than probability-based models (e.g., there’s no PDF). A model of the system: in this case, this is the standard error ansatz. Performance requirement: this is the error estimate for the system, with a mesh-resolved solution estimate based on the computed results. An info-gap model of uncertainty: a family of nested sets involving the uncertain parameters, which determines a non-probabilistic quantification of the uncertainty in the model. • For an info-gap analysis, three elements are required: Credit: Kamm, Witkowski, Rider, Trucano, Ben-Haim, SAND2012-7798C
Info-Gap Solution VerificationAnalysis of a “toy” problem e = “Horizon of Uncertainty” Solution Error • Example: the ODE du/dt = –u(t), u(0) = 1, and two integration schemes, 1storder and 2ndorder,to evaluateu(t=2) = 0.1353. • With three values, the standard approaches are: • Info-gap gives quantitative behavior of uncertainty: Grid Convergence Index u(1) = 0.1216 ± 0.0178 u(2) = 0.1358 ± 0.0016 u(2) = 0.1348 ± E u(1) = 0.1370 ± E 1st order 2nd order Xing & Stern u(1) = 0.1216 ± 0.0337 u(2) = 0.1358 ± 0.0017 • The resulting uncertainty-vs.-esurface is the final outcome of this analysis. Credit: Kamm, Witkowski, Rider, Trucano, Ben-Haim, SAND2012-7798C
Info-Gap Solution VerificationAnalysis of a “real” problem Coarse Mesh Fine Mesh • Obviously, there is no exact solution for this problem. 12.7 mm Vz = -6.1 m s-1 • We analyze the final velocity of the penetrator at t= 8 ms. Al plate 12.7 mm t= 8 ms Calculations performed by Nicole Breivik (Sandia) • Standard approaches using two computed results: • Info-gap results: 1st order There is very little dependence on properties of the estimated mesh-resolved solution, Grid Convergence Index Correction Factor or Xing & Stern Requires ≥ 3 results through a free parameter p* . • Example: Plate penetration problem run with SIERRA SM. Credit: Kamm, Witkowski, Rider, Trucano, Ben-Haim, SAND2012-7798C
A brief history of solution verification e • Roache inverted this relation to estimate the numerical error, given solutions at different resolutions.Since then, others have contributed using the same basic approach ec ef GCI • This approach is being reexamined at a deeper level and alternatives are being proposed ec ec RMR Info-Gap Analysis of mesh-based methods established the power-law form of the truncation error. This is the theoretical foundation upon which numerical methods are based