Download
1 / 12
120 likes | 226 Views
Enrollment and Outcomes. Duckworth W, et al. N Engl J Med 2009;360:129-139. Characteristics of the Patients at Baseline and Follow-up*. Duckworth W, et al. N Engl J Med 2009;360:129-139. Changes in Median Glycated Hemoglobin Levels from Baseline through 78 Months.

E N D
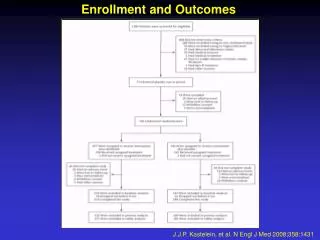
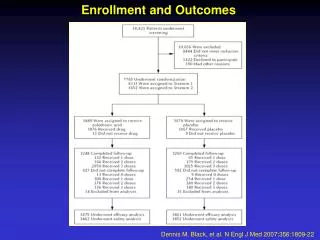
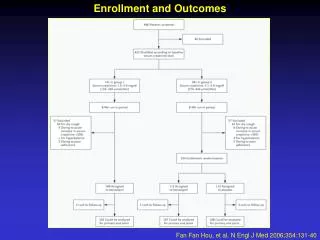
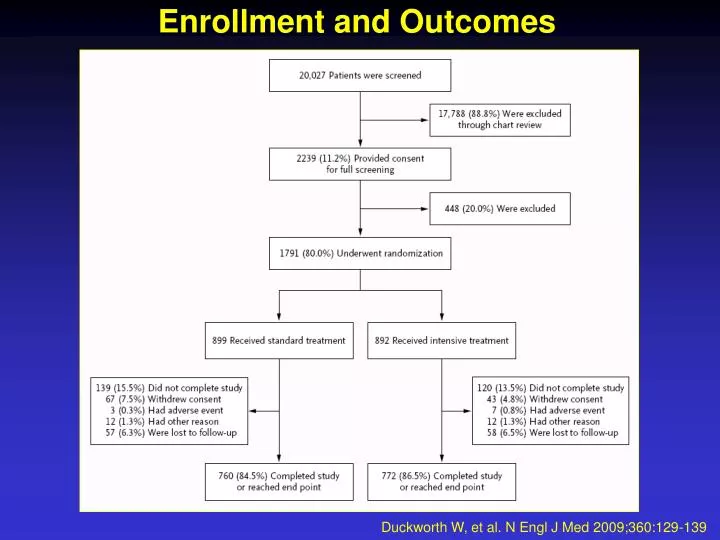
Enrollment and Outcomes Duckworth W, et al. N Engl J Med 2009;360:129-139
Characteristics of the Patients at Baseline and Follow-up* Duckworth W, et al. N Engl J Med 2009;360:129-139
Changes in Median Glycated Hemoglobin Levels from Baseline through 78 Months Duckworth W, et al. N Engl J Med 2009;360:129-139
Kaplan–Meier Curves for the Time until the First Occurrence of a Primary or Secondary Outcome Panel A shows the time until the first occurrence of a major cardiovascular event (the primary outcome), which was a composite of myocardial infarction, stroke, death from cardiovascular causes, congestive heart failure, surgery for vascular disease, inoperable coronary disease, and amputation for ische mic gangrene, in the standard-therapy group and the intensivetherapy group, with a hazard ratio in the intensive-therapy group of 0.88 (95% confidence interval [CI], 0.74 to 1.05). Panel B shows the time until death from a cardiovascular cause (a component of the primary outcome), with a hazard ratio of 1.32 (95% CI, 0.81 to 2.14). Panel C shows the time until death from any cause (a secondary outcome), with a hazard ratio of 1.07 (95% CI, 0.81 to 1.42). Duckworth W, et al. N Engl J Med 2009;360:129-139
Hypoglycemic Episodes* Duckworth W, et al. N Engl J Med 2009;360:129-139
Microvascular Outcomes* Duckworth W, et al. N Engl J Med 2009;360:129-139
Time to Primary Event Duckworth W, et al. N Engl J Med 2009;360:129-139 Supplementary Appendix
Time to Secondary Cardiovascular Events and Total Mortality Duckworth W, et al. N Engl J Med 2009;360:129-139 Supplementary Appendix
Cause of Cardiovascular Death Duckworth W, et al. N Engl J Med 2009;360:129-139 Supplementary Appendix
Cause of Death: Neoplasm (Non-cardiovascular) Duckworth W, et al. N Engl J Med 2009;360:129-139 Supplementary Appendix
Other Causes of Death (Non-cardiovascular) Duckworth W, et al. N Engl J Med 2009;360:129-139 Supplementary Appendix
Reporting of Confirmed SAE at least once during follow-up* Duckworth W, et al. N Engl J Med 2009;360:129-139 Supplementary Appendix