Download
1 / 7
70 likes | 164 Views
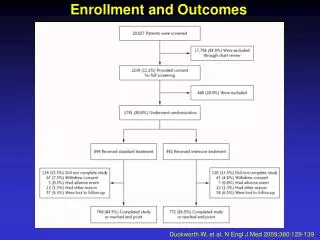
Enrollment and Outcomes. Dennis M. Black, et al. N Engl J Med 2007;356:1809-22. Baseline Characteristics of the Patients – Part I. Dennis M. Black, et al. N Engl J Med 2007;356:1809-22. Baseline Characteristics of the Patients – Part II. Dennis M. Black, et al. N Engl J Med 2007;356:1809-22.

E N D
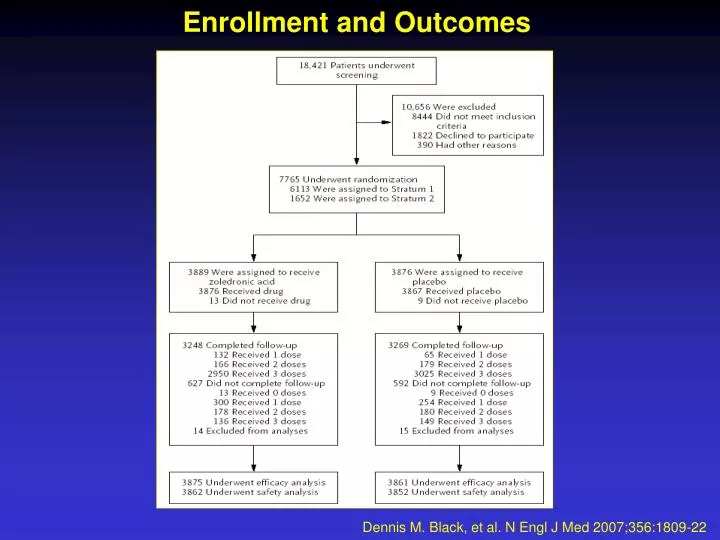
Enrollment and Outcomes Dennis M. Black, et al. N Engl J Med 2007;356:1809-22
Baseline Characteristics of the Patients – Part I Dennis M. Black, et al. N Engl J Med 2007;356:1809-22
Baseline Characteristics of the Patients – Part II Dennis M. Black, et al. N Engl J Med 2007;356:1809-22
Relative Risk of Fracture Incidence in the Two Study Groups* Dennis M. Black, et al. N Engl J Med 2007;356:1809-22
Incidence of Fractures during the 3-Year Study Period The primary end points - the incidence of morphometric vertebral fracture (Panel A) and the 3-year incidence of hip fracture (Panel B) - are shown for both study groups. In Panel A, the 5675 patients in stratum 1 who were included in the analysis underwent radiography at baseline and at least once during follow-up. Any missing data for earlier visits were imputed from later visits, and missing data for later visits were imputed from earlier visits. The total numbers of followup radiographs were 5675 at 1 year, 5308 at 2 years, and 4969 at 3 years. Secondary end points - nonvertebral fracture (Panel C), any clinical fracture (Panel D), and clinical vertebral fracture (Panel E) - are also shown over a 3-year period. In Panels B, C, D, and E, the number of subjects at 36 months is the number who had closeout visits on or after the start of the 36-month window for visits. D.M. Black, et al. NEJM;356:1809-22
Percent Change over Time in Bone Mineral Density and Biochemical Markers Results are shown for bone mineral density at the total hip (Panel A), lumbar spine (Panel B), and femoral neck (Panel C) and for biochemical markers of bone turnover, including serum C-telopeptide of type I collagen (Panel D), serum bone-specific alkaline phosphatase (Panel E), and serum N-terminal propeptide of type I collagen (Panel F). The premenopausal reference ranges (indicated by horizontal lines above and below the study-group points) are based on data from the Os des Femmes de Lyon (OFELY) study. Black, et al. NEJM;356:1809-22
Adverse Events* Dennis M. Black, et al. N Engl J Med 2007;356:1809-22