Download
1 / 16
160 likes | 257 Views
NOAA Hydrometeorological TestBed at the NCEP Hydrometeorological Prediction Center (HPC). Faye Barthold May 4, 2010. Introduction. Purpose

E N D
NOAA Hydrometeorological TestBed at the NCEP Hydrometeorological Prediction Center (HPC) Faye Barthold May 4, 2010
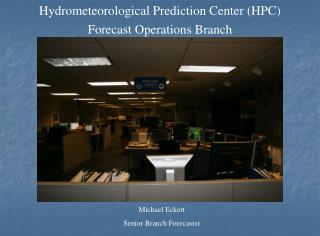
Introduction Purpose Accelerate the assessment and implementation of new technology, research results, and other scientific advancements from the research and development communities to enhance HPC products and services Funded through NCEP and NOAA HMT Staffing One full time contractor One FTE 90% Support from HPC DTB staff Location Collocated with HPC operations
2009 Accomplishments • Introduced rime factor tool to HPC forecasters • Completed a comparison of the 1993 and 2008 Midwest floods • Investigated predecessor rainfall events (PREs)
NAM Rime Factor • What is rime factor? • Indicates amount of riming present on an individual ice particle • Values range from 1 (unrimed snow) to >40 (sleet) • Instantaneous output • Ice accumulation rate • Derived from the rime factor based on an assumption of a maximum possible snow to liquid ratio • Available guidance • Hourly rime factor and ice accumulation rate forecasts from 00Z and 12Z NAM • Estimated 6hr, 12hr, and 24hr total accumulations
Midwest Floods • Rainfall during the 13 day periods of 29 June-11 July 1993 and 1-14 June 2008 resulted in severe flooding over the central US • Represent the two wettest 13 day periods on record in the warm season based on a 60 year climatology • Both events preceded by a wet late winter/spring, resulting in high antecedent soil moisture • Events characterized by similar patterns in 500 hPa geopotential heights, 250 hPa winds, 850 hPa v-winds, and mean sea level pressure • 0.939 correlation between 500 hPa height anomalies between events
Midwest Floods Precipitation and 500mb Height Anomalies 1993 2008
Midwest Floods Moisture Flux
Coherent area of rain located ahead of a tropical cyclone Rainfall rates > 100mm in 24hr Moisture transport between tropical cyclone and PRE Represent an enhanced flooding risk Bring heavy rain to areas outside the path of the tropical cyclone Produce heavy precipitation in advance of the precipitation associated with the tropical cyclone PRE Hurricane Katrina Predecessor Rainfall Events (PREs)
Predecessor Rainfall Events (PREs) Model Performance 36hr GFS forecast valid 12Z 9/25/05 36hr NAM forecast valid 12Z 9/25/05 6hr QPE valid 12Z 9/25/05
Current Projects • Object oriented verification (MODE) • May provide information about model and forecaster biases in specific precipitation regimes • Output will be a component of the on-site HPC QPF experiment • HWT Spring Experiment—QPF component • Goal—evaluate the use of high resolution model and ensemble data for QPF forecasting and identify the challenges associated with using this data
Questions? Faye.Barthold@noaa.gov Mike.Bodner@noaa.gov Edwin.Danaher@noaa.gov
Midwest Floods Precipitation and 500mb Heights—1993
Midwest Floods Precipitation and 500mb Heights—2008