Download
1 / 17
170 likes | 305 Views
Monterey Submarine Canyon Pumps Oxygen into the Abyss McPhee-Shaw, E. E. 1 , E. Kunze 2 , J. Girton 2 & C. Collins 1,3 . Moss Landing Marine Laboratories, San Jose State University, 2. Applied Physics Laboratory, University of Washington. 3. US Naval Postgraduate School . Outline :

E N D
Monterey Submarine Canyon Pumps Oxygen into the Abyss McPhee-Shaw, E. E.1, E. Kunze2, J. Girton2 & C. Collins1,3. Moss Landing Marine Laboratories, San Jose State University, 2. Applied Physics Laboratory, University of Washington. 3. US Naval Postgraduate School . Outline: Intense Mixing in Monterey Submarine Canyon - Stratifiedmixing layers extend some few hundred meters above seafloor. Focused region of boundary-interior mixing, offshore dispersal feature, ~ 900 to 1000 m, Kunze et al., JPO, 2012 New results from same project: Mixing in the “inner” and “middle” reaches of the canyon (~ 300 to 100 0 m), occurs at abyssal depth range of the Oxygen Minimum Zone (OMZ) Result: a redistribution of oxygen in the OMZ: Oxygen mixed from below (and from above?), the minimum is not as intense as it is offshore. Elevated oxygen moves offshore along same dispersal feature we previously identified (Kunze et al., 2012)
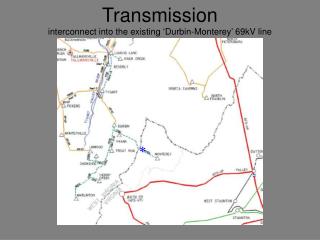
Experiment: • At most stations: • 24 hour occupation, two back-to-back tidal cycles: • first 12 hours: repeated microstructure turbulence profiles. • 2nd 12 hours: repeat CTD/transmissometer profiles. Monterey Submarine Canyon, Central California Coast
Turbulent kinetic energy dissipation rate, ε, profiles, from Vertical Shear Microstrure Profiler (VMP). ε turbulent diffusivity: average 1.6×10⁻³m2 s-1 N Elevated turbulence extends 200 to 300 mab. Yet stratification is maintained (not mixed)
Black lines: isopycnals Red: TKE dissipation rate, ε (turbulence) Blue: Transmissometer beam attenuation coefficient (suspended particulates)
Along-canyon variations in upcanyon transport inferred from turbulent buoyancy flux and buoyancy conservation arguments Mass flux divergence between station 27 and 22, convergence between 22 and 12. Implies import (onshore flow of “clear” water toward boundary) somewhere > 950m export (offshore flow of “turbid” water) somewhere between ~ 950 and 760 m Prediction upheld by persistent intermediate nepheloid layer moving offshore from convergent region
Here’s what this features looks like over a 12-hour semidiurnal time scale Light colors mark relatively high suspended particulate material Red lines are the 27.1 and 27.3 isopycnals, bounding the offshore-spreading boundary layer intrusion (INL) These stations are ones that are far enough offshore to have the intermediate suspended particulate feature be separated far enough from the bottom to be distinct from the usually intense BNLs.
Dissolved Oxygen Profiles, 800 to > 2000 m water depth, (warm to darker colors moving offshore) 440 521 All sites, DO roughly similar at these density surfaces (depths of 500 and 1300 m) 592 675 775 887 The minimum is “much less minimum” in the middle reaches of the canyon. 1076 1269 Mean isopycnal depth
Elevated oxgyen is pumped offshore from the mixing zone, within the same INL offshore-dispersal feature identified in earlier analyses (Kunze et al, 2012). BeamC (Suspended particulates) correlates well with DO offshore, but not at stations within the mixing zone. Stations 42 and 45 Stations 22, 27, and 35
Curt Collins (NPS) has found a similar anomaly in the oxygen minimum region near the Canyon in many sets of CALCOFI data. Collins et al. AGU 2010 Figure 1. Dissolved oxygen (µmol/kg) averaged over the deep oxygen minimum (671 to 813 dbar) during summer 2006 hydrographic surveys.
Implications Anomaly due to mixing, but its magnitude of ~ 5 to 8 μmol kg-1 is roughly similar to the decrease in Pacific deep oxygen over ~ 10 to 30 years attributed to climate change (changes in solubility and ventilation) (estimates vary from 0.2 to 0.5, to 0.7 to 0.5 – 1.1 umol kg-1 yr-1. ((Stramma et al., 2010, Whitney et al., 2007, Mecking et al,2008)). [at various depths, e.g.[200 to 700 m], or at σθ = 26.6, various locations in Pacific] These results point to significant along-isopycnal variability in oxygen over scales of 10 to 20 km near continental margin. [Dispersal Scales are months ] Could cause difficulties for long term monitoring at repeat stations. (MBARI M1 mooring) Canyons and other mixing hotspots along continental margins might provide pelagic fauna with an oasis of relatively higher oxygen in a climate of continuously decreasing oxygen and expanding OMZs.
Spreading rate. Simple estimates ( ) scale U ~ w/ Kz =[1 to 2x10⁻³], L ~ 10 km, H~ 200 m, U ~ [2 to 5 x 10⁻⁴ m s-1] ~ sluggish offshore movement of 20 to 40 meters per day. [ but if you use an Ozmidov scale instead of bulk vertical scale, you get 9 km per day- shows how wildly off you can be w/ such scaling An alternate approach is to assume continuity and the lateral dispersal should be of similar magnitude to the weak up-canyon transports we estimated associated with mixing and restratification, ~ 50 meters per day. Very similar. What about McPhee-Shaw and Kunze, 2002 estimate of U? Continuity estimates offshore / onshore flows ~ < few 100 m per day. NOT FAST!
Previous literature showing that region (kind of like a cirque?) as a flux convergence zone for baroclinic M2 energy flux Carter, G. S., 2010. ‘Barotropic and Baroclinic M2 Tides in the Monterey Bay Region.’ Journal of Physical Oceangraphy, 40, 1766-1783
Monterey Experiment Motivation Kunze et al., 2002 Convergence of internal tide energy flux within the Monterey Canyon. matched ε, TKE dissipation rate. Were ~30 times higher than parameterization estimates (Gregg-Henyey-Polzin) Are canyons mixing hotspots? High flux convergence Energy flux dropped from 5 kW m-1 at canyon mouth to ±1 kW m-1 near head of canyon.
Not only is DO higher than expected in the mid-shelf profiles , as we move offshore, the water column tends back to offshore “climatology” (the regular oxygen minimum), except where there is that suspended sediment feature associated with waters that have spread > 10 km from their origination near the boundary (at that same 27.2 to 27.3 σθisopycnal surface identified before, (Kunze et al, 2012)