Download
1 / 22
220 likes | 228 Views
EG1106 Geographic Information: a primer Mark Cresswell: Room E449b. 15th October 2004 Maps & Representation. TOPICS. What is a map? How do maps provide information? Map Abstraction and Generalisation Using maps to communicate GIS Practical Today and IN TWO WEEKS. What is a map?.

E N D
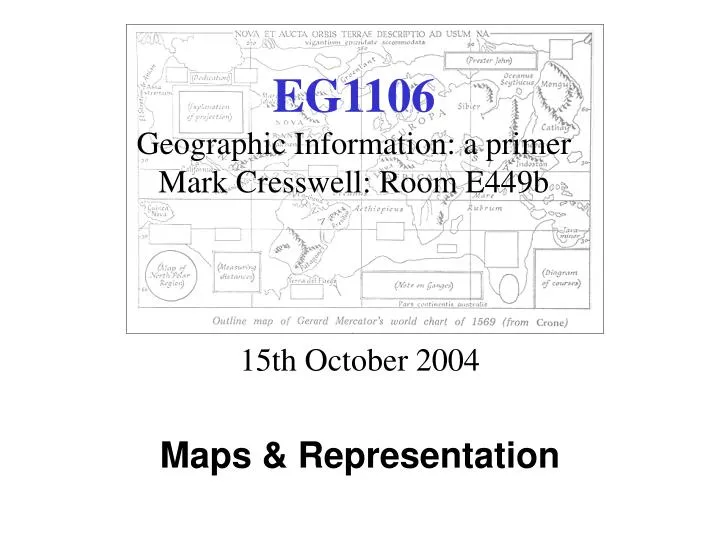
EG1106Geographic Information: a primerMark Cresswell: Room E449b 15th October 2004 Maps & Representation
TOPICS What is a map?How do maps provide information?Map Abstraction and GeneralisationUsing maps to communicateGISPractical Today and IN TWO WEEKS
What is a map? Maps convey information about a place by graphical (or tactile) meansUse of lines, points, symbols, shading and contours convey essential elements about a place.Every map has a spatial frame of reference - such as gridlines (Ordnance Survey for example), geographical co-ordinates (latitude & longitude) or more localised (postcode or political wards)Maps rely on a simplification of reality
What is a map? Is this a map?
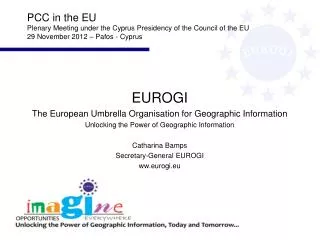
Western and Central Europe Eastern Europe North America Asia Central America Africa Australia and New Zealand South America What is a map? Is this a map?
What is a map? Is this a map? Do all maps have to faithfully replicate even gross features of reality - or can they be exploited to communicate concepts?
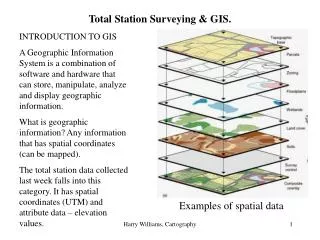
What is a map? The map of the London Underground was originally drawn in the 1920s by Beck who was an electronics draughtsman The Tube map is easily understood by everyone who uses it - but it bears little relation to the “real” railway network layout.
How do maps provide information? Scale and Representation All conventional maps have a SCALE - this tells the user how the features on the map relate spatially to the world it depicts. Without a scale, maps do not inform the user of key information such as DISTANCE and SIZE.
How do maps provide information? Consider the usefulness of this map A B D N C
How do maps provide information? Consider the usefulness of this map A B D N C 100 miles
How do maps provide information? Symbols and colours
Map Abstraction and Generalisation All maps show a simplification of realityComplex real-world features are deconstructed and projected onto a 2-dimensional spatial reference systemMajor features become a collection of lines, points, polygons and symbolsCartographers will take an aerial photograph and produce a map retaining the essential elements - but without the complexity and unimportant information
Map Abstraction and Generalisation GENERALISATION - varies the quantity of detail according to the scale.A map at a scale of 1:100 000 will have only a quarter of the space available for portraying information about a region than a map at a scale of 1:25 000
Map Abstraction and Generalisation ABSTRACTION - This is the process whereby complex features such as drainage channels, road networks and buildings are reduced to:Linesthe thickness of which may not be related to realitySymbolsa church or hospital will have a standard symbol regardless of the size of the hospital or religious denomination of the church
Using Maps to Communicate A map does not have to be a road atlas or A to Z format of publicationMaps can be used to display any data that has a spatial (geographic) component.We can show a map of a region or country and graphically show data in the form of colours and/or symbol size. These are CHLOROPLETH maps.
GIS Geographical Information System Based around computer software Maps become DYNAMIC – they can be updated as often as the information changes Maps can be carried on digital devices – handheld computers with high resolution screens – updateable in real-time.
PRACTICAL TODAY Groups D1, D2, E1 & E2 2 – 3:30 pm In room L106 (Loxford)
PRACTICAL IN 2 WEEKS (29th Oct) Groups A2, B1 and B2 2 – 3:30 pm Groups A1, C1 and C2 3:30 – 5 pm In room L106 (Loxford)