Download
1 / 38
390 likes | 757 Views
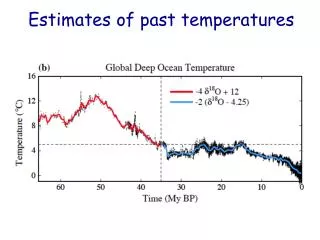
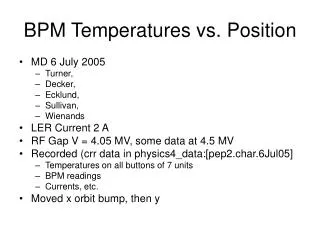
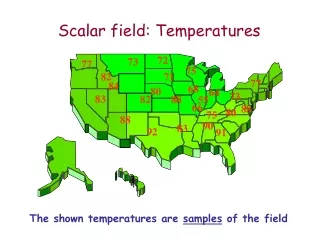
Rising Temperatures. Various Temperature Reconstructions from 200-2008. Arctic Air Temperatures from Proxies ( blue ) and Observed Temperatures ( red ). Temperatures from Proxies and Instruments for Last 1,800 Years. The current temperature rise is unprecedented

E N D
Arctic Air Temperatures from Proxies (blue) and Observed Temperatures (red)
Temperatures from Proxies and Instruments for Last 1,800 Years • The current temperature rise is unprecedented • It coincides with the Industrial Revolution and the exponential population growth • It also coincides with the rapid rise in greenhouse gas emissions
Temperature Anomaly (1880-2009)Base: 1951-1980 Aerosols Aerosols Aerosols
5-year and 11-year Monthly Mean Temperatures for the Entire Earth and the Northern (N.H.) and Southern (S.H.) Hemispheres.(Base is 1951-1980)
Temperature Change from 1850-2009 • Mean surface temperature change for 2001-2007 relative to the 1951-1980 base (top). • Global average temperature 1850-2009 relative to the baseline period 1880-1920 estimated from NASA/GISS data set (red) and the Hadley data (blue). • The final bold point is estimated for 2009.
Hottest Years Ranked by the British Meteorological Office The Current Decade Was the Hottest
Variations of the Arctic Oscillation that are responsible for cold Arctic air reaching lower latitudes (negative values). The extreme negative oscillation for Dec. 2009 is shown.
Temperature Increase 1992-2004 • The yellows and reds on these world maps are positive (warm) anomalies while blues are negative (cool) anomalies. • The greatest amount of heating has occurred generally in the Northern Hemisphere and specifically in the Arctic regions.
CO2 and Temperature Stabilization Data from: IPCC, 2007:Synthesis Report.
Only Human-caused Greenhouse Gas Emissions Can Account for Global Warming • The black line is the observed temperature rise. • The red area is computer simulations of all emissions, including human. • The blue area is computer simulations of only natural emissions and the increase in solar activity.
Earth’s Heat Gain During the Past 50 years (1021 Joules*) • Oceans = 145 (84%) • Continents = 10.4 (6%) • Earth’s Ice = 8.1 (5%) • Atmosphere = 6.6 (4%) *A joule is a unit of heat energy
What Global Average Temperatures Become Critical and Catastrophic for Humans? • The current best estimate is 2° C above pre-industrial levels is potentially critical. About 4° C is potentially catastrophic. The Earth is now 0.8° C above pre-industrial levels. • When the CO2 abundance reaches ~450 ppm the temperature anomaly will eventually exceed 2° C. At ~650 ppm it will eventually reach a minimum of 4° C. • The current abundance (2010) is 388 ppm and rising at a rate of ~2 ppm/year, and this rate is increasing. • We have about 30 years to stabilize the greenhouse gas abundance by cutting emissions ~70% (~80% for CO2 only). Even at today’s abundance the temperature anomaly will reach the critical level in about 40 years.
WHAT ISCRITICALAND WHAT ISCATASTROPHIC? • CRITICAL --- serious drop in food production, serious water shortages, significant sea level rise, political unrest, major drop in world GDP, major animal extinctions and millions of human deaths. Third-world countries, e.g. Africa, are affected most, including large human migrations. • CATASTROPHIC --- mass extinction event (>50% species extinction), major sea level rise, mass starvation, political and economic chaos, ~50% human deaths (>3 billion people). Probably the end of civilization as we know it today.
Projected Temperature Rise for Additional Greenhouse Gases (GHGs)