Download

1 / 33
340 likes | 560 Views
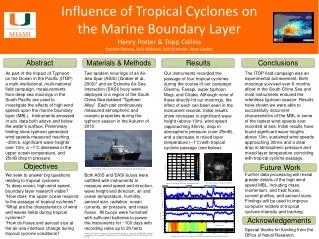
The Tropical Cyclone Boundary Layer 2: Dynamics. www.cawcr.gov.au. Jeff Kepert Head, High Impact Weather Research Oct 2013. Turbulence time scales are short (< 1 hour) Cyclone evolves slowly (~ 10 hours to days) Assume that boundary layer flow in tropical cyclones is the response to

E N D
The Tropical Cyclone Boundary Layer2: Dynamics www.cawcr.gov.au Jeff Kepert Head, High Impact Weather Research Oct 2013
Turbulence time scales are short (< 1 hour) • Cyclone evolves slowly (~ 10 hours to days) • Assume that boundary layer flow in tropical cyclones is the response to • Conditions above the boundary layer (gradient wind, stability structure) • Surface conditions (roughness, fluxes) • One side of two-way interaction • Approach successful for marine boundary layer theory • except for strong horizontal advection • needs modification over land where diurnal effects are strong The Centre for Australian Weather and Climate ResearchA partnership between CSIRO and the Bureau of Meteorology
Theoretical framework • BL affects the TC: • distribution of updraft • thermodynamic properties of updraft • dynamic properties of updraft • TC affects the BL: • distribution of gradient wind / pressure • large-scale divergence asymmetry • turbulent fluxes through top • convective downdrafts Ignore Keep (some of) The Centre for Australian Weather and Climate ResearchA partnership between CSIRO and the Bureau of Meteorology
The Centre for Australian Weather and Climate ResearchA partnership between CSIRO and the Bureau of Meteorology
Types of models • Full nonlinear equations, asymmetric (Kepert and Wang 2001) • Linearised equations, asymmetric (Rosenthal 1962, Kepert 2001) • Depth-averaged equations, nonlinear, asymmetric (Shapiro 1983, Smith 2003, Smith and Vogl 2008) • Depth-averaged equations, nonlinear, symmetric (Smith 2003, Smith and Vogl 2008) • Depth-averaged equations, linear, symmetric (Ooyama 1969, Emanuel 1986) • Prescribed vertical structure, symmetric (Smith 1968, Kuo 1971, Kepert 2010) • One-dimensional (Moss and Rosenthal 1975, Powell 1980) • Most of these models study the response to an imposed, steady, tropical cyclone-like pressure field. • See Kepert (2010, QJRMS) for additional references. The Centre for Australian Weather and Climate ResearchA partnership between CSIRO and the Bureau of Meteorology
Angular momentum axisymmetric axisymmetric inviscid Absolute angular momentum is conserved for inviscid flow The Centre for Australian Weather and Climate ResearchA partnership between CSIRO and the Bureau of Meteorology
The full BL model • Solves the thermodynamic and momentum budget equations over a domain that is hundreds of km across and a few km deep • Upper boundary conditions represent all the effects of the TC on the BL • Prescribed pressure / gradient wind • Storm motion • Convection • Turbulent transfer • Asymmetries (including environmental) • Lower boundary condition has sophisticated air-sea interaction, etc • Includes suitable turbulence closure, other parameterisations • Model described in Kepert and Wang (2001, JAS) and Kepert (2012, MWR) The Centre for Australian Weather and Climate ResearchA partnership between CSIRO and the Bureau of Meteorology
Symmetric Structure The Centre for Australian Weather and Climate ResearchA partnership between CSIRO and the Bureau of Meteorology
Symmetric structure Radial Azimuthal Vertical The Centre for Australian Weather and Climate ResearchA partnership between CSIRO and the Bureau of Meteorology
Comparison to observations Typical model run Obs in H. Isabel (Bell 2010) The Centre for Australian Weather and Climate ResearchA partnership between CSIRO and the Bureau of Meteorology
Flow summary diagram 100w vgr 104ζ v10 -u10 The Centre for Australian Weather and Climate ResearchA partnership between CSIRO and the Bureau of Meteorology
Supergradient flow • fig Black contours: v Shading: v – vgr, zero contour white Vectors u-w The Centre for Australian Weather and Climate ResearchA partnership between CSIRO and the Bureau of Meteorology
Supergradient flow • Inflow produces an azimuthal acceleration (by conservation of angular momentum) • Supergradient flow implies that there is an outwards acceleration • Centrifugal force (outwards) + Coriolis (outwards) > pressure gradient (inwards) • The jet maximum occurs within the inflow layer • What maintains the inflow in the presence of this outwards acceleration? The Centre for Australian Weather and Climate ResearchA partnership between CSIRO and the Bureau of Meteorology
u v friction friction angular momentum advection gradient wind residual vertical advection vertical advection radial advection Contours: 0, +/-{1,2,3…128}*1e-4 m s-2 The Centre for Australian Weather and Climate ResearchA partnership between CSIRO and the Bureau of Meteorology
Supergradient flow • Inflow produces an azimuthal acceleration (by conservation of angular momentum) • Supergradient flow implies that there is an outwards acceleration • Centrifugal force (outwards) > Coriolis (inwards) + pressure gradient (inwards) • The jet maximum occurs within the inflow layer • What maintains the inflow in the presence of this outwards acceleration? • Diffusion and advection of inflow from below, plus self-advection of inflow (less important) The Centre for Australian Weather and Climate ResearchA partnership between CSIRO and the Bureau of Meteorology
Large Variation in Nearby Wind Profiles Azimuthal wind Radial wind Same above BL Inside RMW Outside RMW The Centre for Australian Weather and Climate ResearchA partnership between CSIRO and the Bureau of Meteorology
Hurricane Guillermo (1997) The Centre for Australian Weather and Climate ResearchA partnership between CSIRO and the Bureau of Meteorology
Near-Surface Earth-Relative Flow Radial Flow Azimuthal Flow 5 m/s Strongest inflow to right Strongest winds in right forward quadrant The Centre for Australian Weather and Climate ResearchA partnership between CSIRO and the Bureau of Meteorology
Surface winds Powell (1982, MWR) The Centre for Australian Weather and Climate ResearchA partnership between CSIRO and the Bureau of Meteorology
Asymmetries (earth-relative) Radial (10 m) Azimuthal (10 m) Vertical (400 m) Total flow Asymmetric Wavenumber-1 The Centre for Australian Weather and Climate ResearchA partnership between CSIRO and the Bureau of Meteorology
Asymmetries (storm-relative) Radial (10 m) Azimuthal (10 m) Vertical (400 m) Total flow Asymmetric Wavenumber-1 The Centre for Australian Weather and Climate ResearchA partnership between CSIRO and the Bureau of Meteorology
Surface Wind Reduction Factor -Ratio of surface wind speed to gradient wind • Surface wind factor is 0.6 to 0.8 in outer part of storm. • It increases towards the centre and is 0.8 to 1.0 near the RMW. • It is larger on the left than on the right (in the NH). 5 m/s The Centre for Australian Weather and Climate ResearchA partnership between CSIRO and the Bureau of Meteorology
H. Georges: Observed Surface Wind Factor • Objective analysis, observations plotted as percentage, black ring shows RMW. • No shading => not enough data for analysis. • Largest values (~1) in left eye-wall. • Smallest values to right. • Secondary max associated with outer rainband. |V50| / |V1500| |V50| / |V2500| The Centre for Australian Weather and Climate ResearchA partnership between CSIRO and the Bureau of Meteorology
Hurricane Andrew • Track of Andrew at landfall over Miami in 1992, with positions of surface wind observations for which co-located aircraft data (at altitude ~ 3 km) were available. The Centre for Australian Weather and Climate ResearchA partnership between CSIRO and the Bureau of Meteorology
Hurricane Andrew • From tabulated aircraft-surface wind speed comparison in Powell and Houston (Weather & Forecasting, 1996) The Centre for Australian Weather and Climate ResearchA partnership between CSIRO and the Bureau of Meteorology
Hurricane Mitch (1998) The Centre for Australian Weather and Climate ResearchA partnership between CSIRO and the Bureau of Meteorology
Hurricane Mitch • Convection biased towards left rear of slowly moving storm. • Data courtesy of NOAA/HRD The Centre for Australian Weather and Climate ResearchA partnership between CSIRO and the Bureau of Meteorology
Hurricane Mitch - Comparison of gradient and observed winds 3 km • Pressure profiles were fitted to observations at 100, 200 … 3000 m (left). • Black = Holland • Red = Willoughby • Gradient wind compared to observed storm-relative azimuthal flow (right) • Super-gradient near eye-wall from about 500 m to 2 km. 1.5 km 500 m 100 m GPS dropsonde data from NOAA/HRD The Centre for Australian Weather and Climate ResearchA partnership between CSIRO and the Bureau of Meteorology
Hurricane Georges • Best track from NOAA/NHC The Centre for Australian Weather and Climate ResearchA partnership between CSIRO and the Bureau of Meteorology
Hurricane Georges • From NOAA/NHC reconnaissance aircraft. The Centre for Australian Weather and Climate ResearchA partnership between CSIRO and the Bureau of Meteorology
H. Georges – Observed eyewall wind profiles The Centre for Australian Weather and Climate ResearchA partnership between CSIRO and the Bureau of Meteorology • Data from NOAA/HRD
Georges : Observations and model wind speed The Centre for Australian Weather and Climate ResearchA partnership between CSIRO and the Bureau of Meteorology
Conclusions • Nonlinear model predicts • Supergradient flow in upper boundary layer • Inflow layer becomes shallower towards centre • Surface wind factor increases towards centre, higher on left • Strongest surface winds in right front quadrant • Wind profile variation between storms • Observational evidence for all of this The Centre for Australian Weather and Climate ResearchA partnership between CSIRO and the Bureau of Meteorology