Download
1 / 1
10 likes | 122 Views
Argo Products at the Asia-Pacific Data-Research Center. Konstantin Lebedev , Sharon DeCarlo , Peter Hacker, Nikolai Maximenko , James Potemra , Yingshuo Shen. University of Hawaii – International Pacific Research Center, Honolulu, Hawaii, USA.

E N D
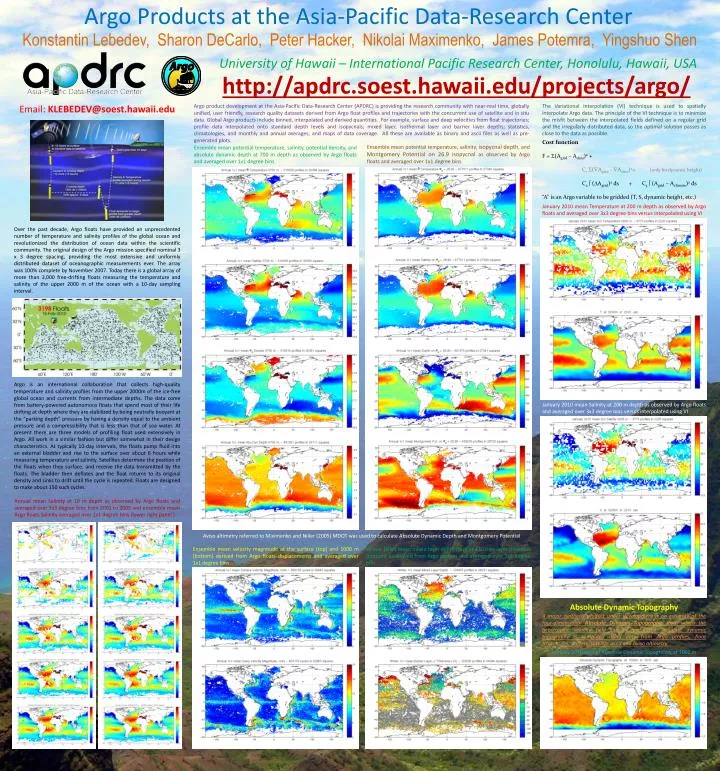
Argo Products at the Asia-Pacific Data-Research Center Konstantin Lebedev, Sharon DeCarlo, Peter Hacker, Nikolai Maximenko, James Potemra, YingshuoShen University of Hawaii – International Pacific Research Center, Honolulu, Hawaii, USA http://apdrc.soest.hawaii.edu/projects/argo/ Email: KLEBEDEV@soest.hawaii.edu Argo product development at the Asia-Pacific Data-Research Center (APDRC) is providing the research community with near-real time, globally unified, user friendly, research quality datasets derived from Argo float profiles and trajectories with the concurrent use of satellite and in situ data. Global Argo products include binned, interpolated and derived quantities. For example, surface and deep velocities from float trajectories; profile data interpolated onto standard depth levels and isopycnals; mixed layer, isothermal layer and barrier layer depths; statistics, climatologies, and monthly and annual averages; and maps of data coverage. All these are available as binary and ascii files as well as pre-generated plots. The VariationalInterpolation (VI) technique is used to spatially interpolate Argo data. The principle of the VI technique is to minimize the misfit between the interpolated fields defined on a regular grid and the irregularly distributed data, so the optimal solution passes as close to the data as possible. Cost function F = (Agrid – Adata)2 + C1(Agrid - Adata)2+ (only for dynamic height) C2 (Agrid)2ds + C3 (Agrid – Aclimate)2ds “A” is an Argo variable to be gridded (T, S, dynamic height, etc.) Ensemble mean potential temperature, salinity, isopycnal depth, and Montgomery Potential on 26.9 isopycnalas observed by Argo floats and averaged over 1x1 degree bins Ensemble mean potential temperature, salinity, potential density, and absolute dynamic depth at 700 m depth as observed by Argo floats and averaged over 1x1 degree bins January 2010 mean Temperature at 200 m depth as observed by Argo floats and averaged over 3x3 degree bins versus interpolated using VI Over the past decade, Argo floats have provided an unprecedented number of temperature and salinity profiles of the global ocean and revolutionized the distribution of ocean data within the scientific community. The original design of the Argo mission specified nominal 3 x 3 degree spacing, providing the most extensive and uniformly distributed dataset of oceanographic measurements ever. The array was 100% complete by November 2007. Today there is a global array of more than 3,000 free-drifting floats measuring the temperature and salinity of the upper 2000 m of the ocean with a 10-day sampling interval. Argo is an international collaboration that collects high-quality temperature and salinity profiles from the upper 2000m of the ice-free global ocean and currents from intermediate depths. The data come from battery-powered autonomous floats that spend most of their life drifting at depth where they are stabilized by being neutrally buoyant at the "parking depth" pressure by having a density equal to the ambient pressure and a compressibility that is less than that of sea water. At present there are three models of profiling float used extensively in Argo. All work in a similar fashion but differ somewhat in their design characteristics. At typically 10-day intervals, the floats pump fluid into an external bladder and rise to the surface over about 6 hours while measuring temperature and salinity. Satellites determine the position of the floats when they surface, and receive the data transmitted by the floats. The bladder then deflates and the float returns to its original density and sinks to drift until the cycle is repeated. Floats are designed to make about 150 such cycles. January 2010 mean Salinity at 200 m depth as observed by Argo floats and averaged over 3x3 degree bins versusinterpolated using VI Annual mean Salinity at 10 m depth as observed by Argo floats and averaged over 3x3 degree bins from 2001 to 2009 and ensemble mean Argo floats Salinity averaged over 1x1 degree bins (lower right panel ) Aviso altimetry referred to Miximenko and Niiler (2005) MDOT was used to calculate Absolute Dynamic Depth and Montgomery Potential Ensemble mean velocity magnitude at the surface (top) and 1000 m (bottom) derived from Argo floats displacements and averaged over 1x1 degree bins Winter (JFM) mean mixed layer depth (top) and barrier layer thickness (bottom) as derived from Argo profiles and averaged over 1x1 degree bins Absolute Dynamic Topography A major synthesis product under development is an estimate of the four-dimensional Absolute Dynamic Topography, from which the geostrophic velocity field can be estimated. Absolute dynamic topography is computed using data from Argo profiles, float trajectories, drifters, satellite wind and Aviso altimetry. January 2010 map of Absolute Dynamic Topography at 1000 m