Download
1 / 29
290 likes | 385 Views
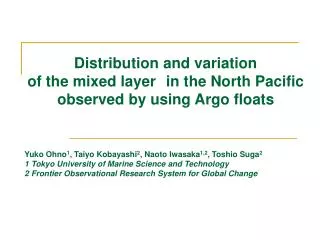
Convection process in the North Pacific from ARGO data. 1 Eunjeong Lee, Yign Noh, 2 Bo Qiu 1 Department of atmospheric sciences, Yonsei University 2 Department of Oceanography, University of Hawaii. Department of Atmospheric Sciences, Yonsei University. Contents. Objective About ARGO

E N D
Convection process in the North Pacific from ARGO data 1Eunjeong Lee, Yign Noh, 2Bo Qiu 1Departmentof atmospheric sciences, Yonsei University 2Department of Oceanography, University of Hawaii Department of Atmospheric Sciences, Yonsei University
Contents • Objective • About ARGO • Data analysis - ARGO - NCEP/NCAR reanalysis I • Results PartⅠ - Response of the ocean to the surface cooling - Deepening of MLD - In the KE region (Eddy process) PartⅡ - Correlation - Efficiency (deepening, heating & cooling) • Conclusion Department of Atmospheric Sciences, Yonsei University
Objective • Analysis of the convection process in the upper ocean to the atmospheric forcing using ARGO data • How are the variations of the MLD and SST related to the surface forcing? i) Understanding the air-sea interaction in the North Pacific ii) Providing the information for the parameterization of convection in the mixed layer model Department of Atmospheric Sciences, Yonsei University
About ARGO • Processing • Position of float • Profile data, metadata, trajectories and technical data • An ascending profile with measurements (e.g. pressure, temperature, salinity) • Data mode (e.g. R : Real time, D : Delayed mode, A : adjusted values) • Quality control (e.g. 1:good data, 4:bed data, 9:missing value) Department of Atmospheric Sciences, Yonsei University
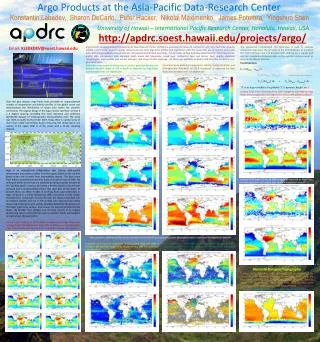
Data analysis : ARGO • 27 different locations • Area : North Pacific (130-240˚E, 20-60˚N) • 0-500m depth • Period : 2001 - 2007 • Data processing • - use data with quality control 1 or 2. • - semi-monthly averaging • - mixed layer depth : z = z [T(0)-0.5] Department of Atmospheric Sciences, Yonsei University
Data analysis : NCEP data • NCEP reanlaysis I – surface heat flux, SST • Surface heat flux • (+) : direction from atmosphere to ocean • Data processing • semi-monthly averaging • 2001-2007 data on an average compare with each year value Department of Atmospheric Sciences, Yonsei University
Location Mean Each year Heat Flux SST MLD Part Ⅰ : Response of the ocean to the surface cooling • 150-155˚E, 28-30˚N • 135-140˚E, 28-30˚N 2005-2006년 2005-2006년 Reduce Department of Atmospheric Sciences, Yonsei University
slower deepening faster deepening Part Ⅰ : Deepening of MLD in winter 135-140˚E, 28-30˚N Location 2004-2005년 2005-2006년 Heat Flux SST MLD Department of Atmospheric Sciences, Yonsei University
Insensitive to surface heat flux Part Ⅰ :Deepening of MLD in winter 175-180˚W, 42-44˚N Location 2003-2004년 2002-2003년 Heat Flux SST MLD Department of Atmospheric Sciences, Yonsei University
The KE region • Near 145˚E, 35˚N • High T & S (20°, 34.5‰), 50~300m/s velocity • Eddy process Department of Atmospheric Sciences, Yonsei University
The KE region PDO index EKE level [Qiu et al.(2008)] • Center of action of wind forcing is in the eastern half of the N Pacific basin • Positive (negative) phase of PDO generates – (+) local SSH through Ekman divergence (convergence) Department of Atmospheric Sciences, Yonsei University
Part Ⅰ :Eddy process 145-150˚E, 32-34˚N Location 2004-2005년 2005-2006년 Heat Flux SST MLD Department of Atmospheric Sciences, Yonsei University
Part Ⅰ :Eddy process Kuroshio Extension • 155-160˚E, 32-34˚N 2005-2006년 Location the effect of internal ocean dynamics is important → eddy process Due to eddy processing MLD Eddy processing interrupt MLD deepening Department of Atmospheric Sciences, Yonsei University
No horizontal advection Part Ⅱ :Relation d(MLD)=MLD(t+15)-MLD(t) • 130-135˚W, 50-52˚N d(MLD)&Qdt d(SST)&Qdt SST&MLD Department of Atmospheric Sciences, Yonsei University
Part Ⅱ :Relation • 155-160˚E, 32-34˚N d(MLD)&Qdt SST&MLD d(SST)&Qdt horizontal advection Department of Atmospheric Sciences, Yonsei University
-0.1 -0.05 -0.6 -0.5 -0.4 -0.3 -0.2 0.05 0.1 0.2 0.3 0.4 0.5 0.6 -0.8 0 0.8 Part Ⅱ : Correlation summer • d(MLD) & Qdt MAY & JUN JUL & AUG d(SST)Qdt • Strong heating→strong stratification • → shallower MLD • Weak correlation in the KE region duo to advection effect • Already shallow MLD • → no longer weakening of MLD Department of Atmospheric Sciences, Yonsei University
-0.1 -0.05 -0.6 -0.5 -0.4 -0.3 -0.2 0.05 0.1 0.2 0.3 0.4 0.5 0.6 -0.8 0 0.8 Part Ⅱ : Correlation Earlysummer • d(MLD) & Qdt Weak eddy Strong eddy Department of Atmospheric Sciences, Yonsei University
-0.1 -0.05 -0.6 -0.5 -0.4 -0.3 -0.2 0.05 0.1 0.2 0.3 0.4 0.5 0.6 -0.8 0 0.8 Part Ⅱ : Correlation winter • d(MLD) & Qdt NOV & DEC JAN & FEB d(SST)Qdt • Strong cooling →weak stratification • → rapid convective deepening • Weak correlation in the KE region duo to advection effect • Already deep MLD • → no longer deepening of MLD • : Maximum MLD is insensitive to surface cooling Department of Atmospheric Sciences, Yonsei University
-0.1 -0.05 -0.6 -0.5 -0.4 -0.3 -0.2 0.05 0.1 0.2 0.3 0.4 0.5 0.6 -0.8 0 0.8 Part Ⅱ : Correlation Early winter • d(MLD) & Qdt Weak eddy Strong eddy Department of Atmospheric Sciences, Yonsei University
Part Ⅱ : Deepening efficiency • Deepening efficiency Department of Atmospheric Sciences, Yonsei University
Stronger efficiency than NOV& DEC except KE region -0.02 -0.01 -0.005 -0.004 -0.001 0 0.001 11 0.003 12 0.004 0.005 0.007 0.01 0.02 -0.007 -0.003 -0.002 0.002 Part Ⅱ : Deepening efficiency winter • Deepening efficiency NOV & DEC JAN & FEB • Overall positive efficiency • Negative efficiency in the KE region Department of Atmospheric Sciences, Yonsei University
Part Ⅱ : Heating(Cooling) efficiency • Heating(Cooling) efficiency Department of Atmospheric Sciences, Yonsei University
-0.02 -0.01 -0.005 -0.004 -0.001 0 0.001 11 0.003 12 0.004 0.005 0.007 0.01 0.02 -0.007 -0.003 -0.002 0.002 Part Ⅱ : Heating(Cooling) efficiency summer • Heating efficiency MAY & JUN JUL & AUG Advection + heating effect Low heating efficiency Department of Atmospheric Sciences, Yonsei University
Advection + heating effect Advection + cooling effect -0.02 -0.01 -0.005 -0.004 -0.001 0 0.001 11 0.003 12 0.004 0.005 0.007 0.01 0.02 -0.007 -0.003 -0.002 0.002 Part Ⅱ : Heating(Cooling) efficiency winter • Cooling efficiency NOV & DEC JAN & FEB Low cooling efficiency Department of Atmospheric Sciences, Yonsei University
Conclusion • The response of the ocean mixed layer and sea surface temperature to surface forcing in the Pacific was investigated by analyzing ARGO data. • The d(SST) and d(MLD) has high correlation and efficiency with surface cooling except in the KE region in early summer and winter. • The d(MLD) are more sensitive to the surface heat flux in late summer and winter. • The initial convective deepening shows large variability, but the maximum MLD does not show much variability. • In the KE region, • - the MLD increase is interrupted by mesoscale eddies • - the heat transport by the Kuroshio is important to determine SST Department of Atmospheric Sciences, Yonsei University
Reference • Argo Data Management Team (2004), Argo quality control manual, version 2.0b, p. 23, Argo Data Manage., Toulouse, France. • Kalnay, E., M. Kanamitsu, R. Kistler, W. Collins, D. Deaven, L. Gandin, M. Iredell, S. Saha, G. White, J. Woollen, Y. Zhu, M. Chelliah, W. Ebisuzaki, W. Higgins, J. Janowiak, K. C. Mo, C. Ropelewski, J. Wang, A. Leetmaa, R. Reynolds, R. Jenne, and D. Joseph (1996), The NCEP/NCAR 40-Year Reanalysis Project, Bull. Am. Meteorol. Soc., 77, 437- 471. • Qiu, B., S. Chen, and P. Hacker (2007), Effect of mesoscale eddies on Subtropical Mode Water variability from the Kuroshio Extension System Study (KESS), J. Phys. Oceanogr., 37, 982-1000. Department of Atmospheric Sciences, Yonsei University
Thank you Department of Atmospheric Sciences, Yonsei University
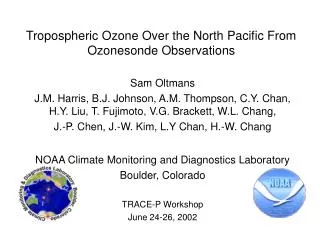
(a) Upstream KE path length (141-153°E) (b) Eddy kinetic energy (141-153°E, 32-38°N) Stable yrs: 1993-94, 2002-04 Unstable yrs: 1996-2001, 2006-07