Download
1 / 19
200 likes | 377 Views
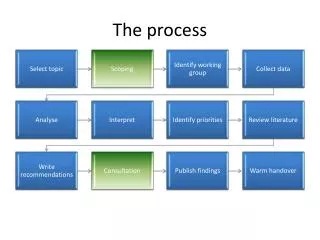
The Process . Identify Early Warning Indicators Implementation Establish Central and Building Understanding Identify, Plan and Support Intervention. Background. Replicated a 2008 study: Consortium on Chicago School Research

E N D
The Process • Identify Early Warning Indicators • Implementation • Establish Central and Building Understanding • Identify, Plan and Support Intervention PPI: 2/11/2013
Background • Replicated a 2008 study: Consortium on Chicago School Research • Examined the impact of 15 different variables on high school graduation. • Found 4 variables that significantly impact variation in high school graduation in Yonkers. PPI: 2/11/2013 3
The Four Risk Factors PPI: 2/11/2013
Five Groups of At-Risk Students • Unidentified Risk* = student carries none of the first 3 risk factors (irrespective of PreK); • Low Risk = student carries 1 of the first 3 risk factors – irrespective of PreK; • Moderate Risk = student carries 2 of the first 4 risk factors – including PreK; • Moderately High Risk = student carries 3 of 4 risk factors – including PreK; • High Risk = student carries all of the first 3 risk factors – (irrespective of PreK). * Although this group of students does not carry any of the four identified risk factors, they are not without risk from factors beyond those identified in this study that may impact graduation. PPI: 2/11/2013
4-Year Graduation Rate and Students without Identified Risk in 2012-13 PPI: 2/11/2013
Summary, School Level PPI: 2/11/2013
Student Detail, School Level PPI: 2/11/2013
Student Detail (continued) PPI: 2/11/2013
Student Detail (continued) PPI: 2/11/2013
Student Detail (continued) PPI: 2/11/2013
Student Detail (continued) PPI: 2/11/2013
Current Status • Early warning indicators ready by school and student. • No distribution or roll-out to high schools. • Limited information presented to Central Office. PPI: 2/11/2013
Contributions to Status • Data: Understanding, comfort, and use. • Opportunity structure for intervention. • Consequences of funding • Support staff • Intervening events • Teacher Evaluation System PPI: 2/11/2013
Strengths • Successful capacity building • Taking advantage of Superintendent interest and support for Early Warning • General enhancement of value and visibility of Data and Systematic Analysis • Local university as a resource. • Staff member in doctoral program. • In-house capacity to sustain analyses. • Update and Implement for Fall 2013. PPI: 2/11/2013
Implementation Fall 2013 • Roll out for opening of 2013-14 in August 2013 • Update analysis and reports with 2012-13 data. • “Reserve” time on Summer Institute schedule. • Principals’ August time is at a premium. • Opportunity to prepare people as well as information. PPI: 2/11/2013
Implementation (continued) • Attendance as a means to reduce course failures and increase GPA. • Teachers and staff should be proactive in helping students as soon as they begin missing classes. • Staff, students and parents attention to the robust connection between absences academic performance future goals. Heppen and Therriault (2008); Allensworth, E. M., & Easton, J. Q. (2007) PPI: 2/11/2013
Implementation (continued) • Other Practices Identified in Literature • By Grade: • Provide schools with lists of grade9 students, ranked by number of absences in first 30 days. Systematically target those with the highest number of absences. • Provide schools with lists of grade9 student at the end of the 1st semester, grouped by risk (GPA, attendance, and number of F’s) • Follow students in grades10and11 to differentiate intervention by level of risk. • By Level of Risk • Low and moderate risk groupings may benefit from more modest intervention such as mentoring or subject specific support. • Moderately-high and high risk groupings are likely to require more comprehensive monitoring and interventions. Heppen and Therriault (2008); Allensworth, E. M., & Easton, J. Q. (2007) PPI: 2/11/2013
Additional Suggestions from the Literature • Intervention should be integrated and closely aligned with the instructional program of the school. • Grades and attendance are better than expected in schools where the instructional program is more coherent. • Programs that support the transition to high school should closely monitor grades and attendance and intervene when students show signs of struggling. • Educators should make efforts to improve teacher-student relationships and help students understand the connection of their coursework to future goals. Allensworth, E. M., & Easton, J. Q. (2007) PPI: 2/11/2013
Student Information, Assessment and Reporting David H. Weinberger, Ph.D. Executive Director Dweinberger@Yonkerspublicschools.org Shanit Halperin, M.A. Research Analyst Shalperin@Yonkerspublicschools.org http://www.yonkerspublicschools.org PPI: 2/11/2013