Download
1 / 18
180 likes | 186 Views
Valuation of NextGen Capacity Benefits. A Consumer Surplus Approach to the Monetization of NASPAC Results. For: INNOVATIONS IN NAS-WIDE SIMULATION Conference By: Michael Wells, NextGen Business Case Integration Date: January 28, 2010. One Goal of NextGen is Increased Throughput.

E N D
Valuation of NextGen Capacity Benefits A Consumer Surplus Approach to the Monetization of NASPAC Results For: INNOVATIONS IN NAS-WIDE SIMULATION Conference By: Michael Wells,NextGen Business Case Integration Date: January 28, 2010
Defining the Benefits of Increased Throughput Delay per Flt Current System NextGen Future Operating Point without NextGen Future Delay, without NextGen Current Operating Point Avoided Delay Future Delay, with NextGen Future Operating Point,with NextGen Current Delay Flights Current Throughput Future Throughput, without NextGen Future Throughput, with NextGen Additional Flights
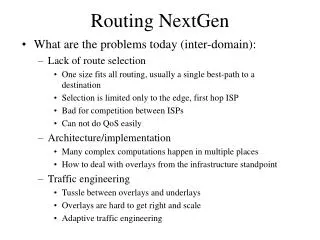
Designing the Experiment in NASPAC Three scenarios are modeled • "Do Nothing“ Case • 2007 airport capacities, technologies, and procedures • “Runways Only“ Case • New runways, runway extensions, and airport configurations included as they are projected to occur • “NextGen” Case ( = Runways + ATM Improvements ) • New runways, runway extensions, and airport configurations included as they are projected to occur • NextGen technologies and procedures also included
Weather Demand Capacities Modeling… FAA’s NASPAC is used to produce metrics for each scenario
Less Delay in 2019 compared to the Baseline 21% delay reduction in 2019 compared with the baseline v5d Total Delay = Push-Back Delay + Taxi-Out Delay + Airborne Delay
More Flights in 2019 compared to the Baseline 66,000 more flights in 2019 compared with the baseline v5d
We Consider Delay as a Cost to the Passenger $ per Flight Baseline Delay Cost D Flights
Generalized Cost includes both Fare and Delay Consumer Surplus $ per Flight LRMC +Delay Cost $$ Cost of Delay (ADOC + PVT) D LRMC Direct Cost of Unimpeded Flight Flights Note: We define “Long Run Marginal Cost” (LRMC) as the equilibrium cost of providing a flight in the absence of delay
Reducing Delay Increases Consumer Surplus LRMC + NextGen Delay Increased Consumer Surplus $ per Flight LRMC +Delay Cost $$ $ D LRMC Flights Note: We define “Long Run Marginal Cost” (LRMC) as the equilibrium cost of providing a flight in the absence of delay
Change in Consumer Surplus Can be Calculated LRMC + NextGen Delay Increased Consumer Surplus $ per Flight LRMC +Delay Cost $$ $ D LRMC Flights Note: We define “Long Run Marginal Cost” (LRMC) as the equilibrium cost of providing a flight in the absence of delay
Our Formula Assumes a Linear Demand Curve $ per Flight Benefits = ( ∆ Delay Cost x Flights Base ) + ½ ( ∆ Delay Cost x ∆ Flights ) $$ $ D LRMC Flights Note: We define “Long Run Marginal Cost” (LRMC) as the equilibrium cost of providing a flight in the absence of delay
Applying this Formula to NASPAC Results Value of Avoided Delayfrom NASPAC (2019) = $ 4 Billion
We Also Included Supplemental Estimates of Programs Not Modeled in NASPAC $ 2 Billion from other studies $ 4 Billion from NASPAC
Summary of our Assumptions • Long Run Marginal Cost is constant over time (i.e. – the airlines’ supply curve is flat) • There is no “producer surplus” • Cost-per-minute of delay is the same for all flights • Our demand function is not explicit, but implied • Flights are trimmed (or added) based on capacity constraints • Assume a linear demand curve for calculating consumer surplus
Program Office Studies Used • ADS-B • DataComm Segments 1 and 2 • Oceanic In-Trail Climb and Descent • Integrated Arrival/Departure Airspace • Surface Traffic Management • CATM - Work Package 2 • AIM Modernization • NextGen Network-Enabled Weather (NNEW) • SWIM Segment 1 • AJP CDA Fuel Savings