Download

1 / 23
230 likes | 309 Views
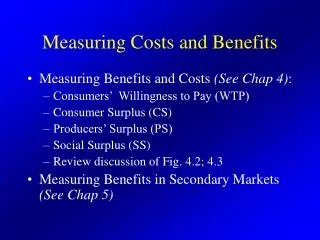
VALUATION OF BENEFITS AND COSTS 1. WHEN MARKETS CLEAR. First Questions First. Is there a market failure that could justify government action? Does it matter? What would happen without government intervention? What should government do? Different answers? Which is better?.

E N D
VALUATION OF BENEFITS AND COSTS 1 WHEN MARKETS CLEAR
First Questions First • Is there a market failure that could justify government action? • Does it matter? • What would happen without government intervention? • What should government do? • Different answers? Which is better?
Next Come Valuation Questions • Is the demand schedule linear (or can we reasonably assume it is)? • Do we have to worry about income effects? ASSUMING THE ANSWERS ARE YES AND NO • Does the market clear? • Are costs constant? • Are there market imperfections?
Project Cost Example The marginal cost of supplying concrete is MC=0.01Q, Where Q=1 million cubic yards of concrete. Because the supplier has a local monopoly, concrete is actually sold according to the supply curve P=0.02Q. The inverse (private) demand for concrete is P=6-0.04Q, Which implies the following demand, Q=150-25P. Solving for Q, P, CS & PS, we have: 6-0.04Q = 0.02Q 6 = .06Q, 100 = Q P = .02(100) = $2.00 CS = 100M(6-2)/2 = $200M, PS = 100M[(2+1)/2] = $150M
Adding the project The project will require 50M cubic yards of concrete, adding 50Q to Q=150-25P, gives us Q=200-25P or an inverse demand function of P=8 -.04Q. Once again, solving for Q, P, private consumption, CS, and PS, we get: 8 = .06Q, 133.33M = Q, P = $2.67 Private demand = 133.33M - 50M = 83.33M (of course 2.67 = 6 -.04Q = 83.33 = Q) CS = .5[83.33(6-2.67)] = $138.89M, -$61.11M PS= 133.33[(2.67+1.33)/2] $266.67M, +$116.67M Budget cost = $2.67*50M = -$133.33M
Net cost of project = -61.11 - 133.33+116.67 = -77.77 or [(100 83.33)(2+2.67)/2]+[(133.33-100)*(1.33+1)/2] =38.88+38.89 = -77.77