Download
1 / 6
60 likes | 151 Views
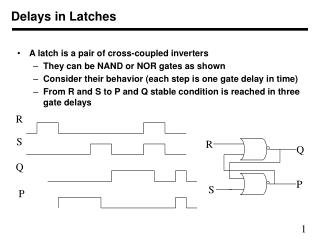
Monitoring the JMR Wet Path Delays. Shailen Desai Bruce Haines Victor Zlotnicki. JMR versus ECMWF. +3-4 mm step between cycles 29-32 -5 mm step at cycle 2 caused by change to ECMWF model. Comparisons to GPS observations. Similar +4-5 mm step in JMR path delays found in comparisons to GPS.

E N D
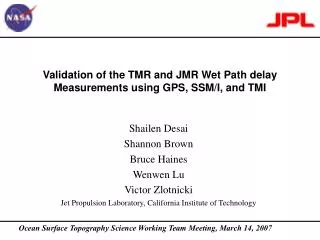
Monitoring the JMR Wet Path Delays Shailen Desai Bruce Haines Victor Zlotnicki
JMR versus ECMWF • +3-4 mm step between cycles 29-32 • -5 mm step at cycle 2 caused by change to ECMWF model Jason-1 Science Working Team Meeting Cal/Val Splinter Session
Comparisons to GPS observations • Similar +4-5 mm step in JMR path delays found in comparisons to GPS. • ECMWF model relatively stable in comparison. • Smaller scatter after cycle 36 when ECMWF model modified. • Smaller scatter in (JMR-ECMWF) differences (from 1.5 to 1.25 cm). Jason-1 Science Working Team Meeting Cal/Val Splinter Session
Comparison to SSM/I and TMI Jason-1 Science Working Team Meeting Cal/Val Splinter Session
Attitude Dependence • Attitude dependence of JMR wet PD correction may have returned after cycle 33. • Verification by other methods pending (e.g. SSM/I and TMI). Jason-1 Science Working Team Meeting Cal/Val Splinter Session
Geographically Correlated Error? Cycles 2-27 • Comparisons to SSM/I and TMI suggest possible geographically correlated errors in JMR wet PD. • Color scale is from -9 to +9 mm. Cycles 29-59 Jason-1 Science Working Team Meeting Cal/Val Splinter Session