Download
1 / 59
590 likes | 712 Views
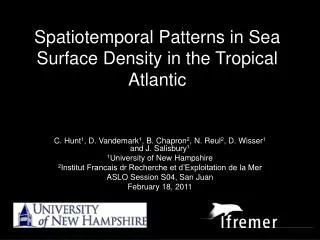
Spatiotemporal Analysis of Surface Water Tetrachloroethene in New Jersey. Presentation of the project of Yasuyuki Akita Temporal GIS Fall 2004. Agenda. About Tetrachloroethene Monitoring Data Details of BME Method BME Analysis Results of BME Analysis New Criterion Model Comparison

E N D
Spatiotemporal Analysis ofSurface Water Tetrachloroethene in New Jersey Presentation of the project of Yasuyuki Akita Temporal GIS Fall 2004
Agenda • About Tetrachloroethene • Monitoring Data • Details of BME Method • BME Analysis • Results of BME Analysis • New Criterion • Model Comparison • Conclusion
About Tetrachloroethene • Tetrachloroethene: C2Cl4 • Volatile organic compound • Nonflammable colorless liquid at room temperature • Ether-like odor • Synonym: Tetrachloroethylene, Perchloroethylene, and PCE
Use and Production • Mainly Used for dry cleaning, chemical intermediates, and industrial solvent • PCE used in dry cleaning industry has been declining during 90s • Recent Demand: 763 million lb (1980) 318 million lb (1999)
Exposure pathway • Primary route • Inhalation • Ingestion of contaminated food and water • Widely distributed in environment • 38% of surface water sampling sites in the U.S. • 771 of the 1430 National Priorities List sites • 154 of 174 surface water samples in N.J. (1977~1979)
Health Effect of Tetrachloroethene • Acute Effect (inhalation exposure) • Dizziness, headache, sleepiness, confusion, nausea, difficulty in speaking and walking, unconsciousness, and death • Chronic Effect (oral/inhalation exposure) • Detrimental effect to kidney and liver
Carcinogenicity • Reasonably anticipated to be a human carcinogen (US DHHS) • Group 2A (Probably carcinogenic to humans) (IARC) • Animal studies: tumors in liver and kidney
Quality Standard for Tetrachloroethene • Maximum Contaminant Level (MCL) in drinking water - 0.005 mg/L • Surface Water Quality Standard in New Jersey - 0.388 μg/L N.J. adopted more stringent standard
Monitoring Dataset for New Jersey • Data Source • NJDEP/USGS Water Quality Network Website • EPA STORET database • Data used in this study • 369 measured values • 171 monitoring stations • From 1999 to 2003
Monitoring Data – Histogram Raw Data Log-Transformed Data
What we want to know is … • Challenge of our research • Assess all river reaches • Taking into account the space/time variability Framework for the space/time estimation Bayesian Maximum Entropy (BME) analysis of TGIS
Space/Time Random Field • The concentration field is modeled in terms of Space/Time Random Field (S/TRF) • Collection of random variables S/TRF: Collection of all possible realization • Stochastic characterization of S/TRF is provided by multivariate PDF
Knowledge Base • General Knowledge Base: G • Describe global characteristics of the random field of interest • Expressed as statistical moments • Site-specific knowledge Base: S • Available monitoring data over the space/time domain of interest • Total Knowledge Base: K • K = G∪ S
General Knowledge Base G Mean Trend • Global trend of the S/TRF of interest • Covariance • Measure of dependency between two points • Sill = variance = covariance(r=0) • Range shows the extent that co-variability exists
BME analysis of Temporal GIS • Prior stage • Examine all general knowledge base G and calculate Prior PDF • Integration stage • Update Prior PDF using Bayesian conditionalization on the site-specific knowledge base S and obtain posterior PDF • Interpretive stage • Obtain estimation value from Posterior PDF
BME analysis of Temporal GIS • General KB Prior PDF • Update prior PDF with Site-specific KB • Bayesian conditionalization • Posterior PDF is given by conditional probability
t t Posterior PDF at estimation point long long lati lati fK(ck) Estimation Value Summary of BME analysis of TGIS • General KB • Mean trend • Covariance • Site-Specific KB • Hard Data BME Estimation Point Data Point
S/TRF for Log-transformed PCE concentration • S/TRF representing Log-tranformed concentration: • Residual field describes purely stochastic aspect of the concentration field Mean Trend Residual Field
Mean Trend of Log-transformed concentration field • Mean trend consist of two components • Purely spatial component • Purely temporal component • Each component is calculated by exponential smoothing
Mean Trend – Temporal Component • Increase from Jan. 1999 to Jan. 2003 • Decrease from Jan. 2003~
Mean Trend – Spatial Component • Contaminated Area • Northeastern region • Southwestern region
Homogeneous/Stationary S/TRF Log-transformed data • Homogeneous/Stationary Random Field • Its mean trend is constant • Its covariance is only function of the spatial lag and temporal lag Removing the mean trend Residual data for S/TRF:
Experimental Data Covariance Model Covariance Surface
BME Estimation – Spatial Distribution (Apr. 15, 2002)
BME Estimation – Contaminated Area Area above the quality standard: 0.388μg/L (Apr. 15, 2002) • BME mean estimate • Upper bound of the BME 68% confidence interval • Upper bound of the BME 95% confidence interval
BME Estimation – Along River Stream • Equidistance points along river stream • More accurate estimation for surface water
BME Estimation – Along River Stream • Fraction of river miles that does not attain the quality standard
Assessment Criterion • S/TRF is characterized by Posterior PDF • Area under the curve = Probability Prob[PCE>QSTD]=Area under the curve (QSTD<PCE<∞)
Assessment Criterion Prob[Non-Attainment]=Prob[PCE>0.388μg] • Highly Likely in Attainment • Prob[Non-Attainment]<10% • Highly Likely in Non-Attainment • Prob[Non-Attainment]>90% • Non-Assessment • 10%≦Prob[Non-Attainment]≦90% • More Likely Than Not in Non-Attainment • Prob[Non-Attainment]>50%
Identifying Contaminated WMAs • The state of New Jersey is divided into 20 Watershed Management Area (WMA) • Assess which part of the state is contaminated • Contribution of each WMA to the fraction of river miles assessed as • Highly Likely in Non-Attainment • More Likely Than Not in Non-Attainment
Contribution of WMAs • Highly Likely in Non-Attainment
Contribution of WMAs • More Likely Than Not in Non-Attainment