Download
1 / 21
220 likes | 339 Views
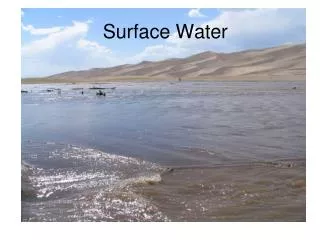
Lead-Zinc Adsorption in Surface Water. Christopher Capecchi Geochemistry Geol 628 – 11.30.2010 North Dakota State University. Overview. Source Onion Creek water chemistry Field measurements MINITEQA2 model PHREEQC model. Onion Creek [1]. Columbia River [2]. Source. Van Stone Mine

E N D
Lead-Zinc Adsorption in Surface Water Christopher Capecchi Geochemistry Geol 628 – 11.30.2010 North Dakota State University
Overview • Source • Onion Creek water chemistry • Field measurements • MINITEQA2 model • PHREEQC model Onion Creek[1] Columbia River[2]
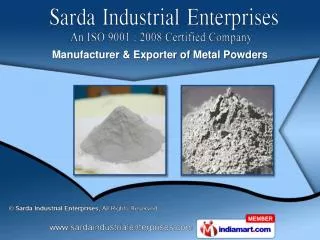
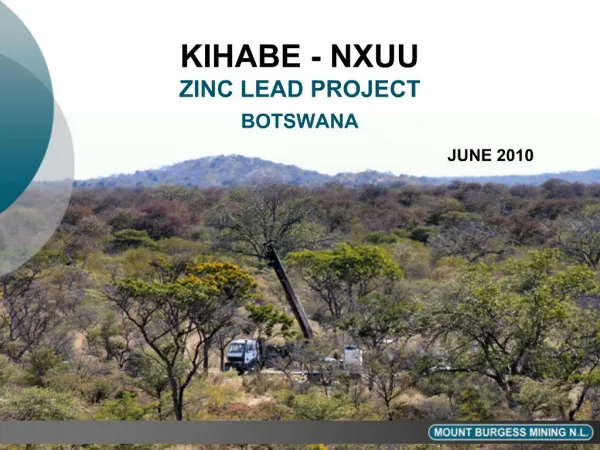
Source • Van Stone Mine • Open pit mine (1952-1970), (1991-1993) • Sphalerite (zinc iron sulfide), galena (lead sulfide), chalcopyrite (copper iron sulfide) • Zinc, lead, and silver • 8.77 million tons combined ore and waste North pit[3] West end pit lake[3]
Source • Mine tailing pond barriers breached over time • Intense rainfalls likely overflowed ponds • The result, moderate contamination of Onion Creek South pit[4] North pit[3]
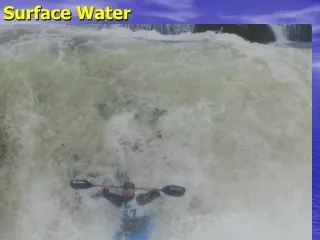
Water Chemistry • Environmental Concerns • Transport of contaminants to Columbia River • Biological uptake by plants and aquatic species Columbia River [6] Carp in lower Onion Creek [7]
MINITEQA2Modeling • Measured samples show decreasing concentrations of lead and zinc downstream • Theories proposed: • Enhanced carbonate dissolution (increasing pH) • Sorption to oxides • Change from carbonate to granite
MINITEQA2 Modeling • Diffuse double layer model • Precipitation-dissolution reactions • Ferrihydrite adsorption • Hematite, diaspore, calcite, dolomite, barite, and manganite at equilibrium, with SI ~ 0 • pH range 7.8-8.4
MINITEQA2 Results • Complete adsorption of Pb2+ and Zn 2+ to ferrihydrite rather than surface precipitation • Pb2+ and Zn 2+ will remain immobilized unless pH is drastically lowered (pH≥4) • Onion Creek not source of contamination for Columbia River • Stream sediments major sink for TE’s • Model uses enrichment factor vs. flow rate • Model dependent upon conductivity, not ORP
PHREEQC Inputs • MINITEQA2 results show small differences compared with field measurments • PHREEQC Inputs: (1) mixing, (2) sorption, (3) equilibrium phases • ORP not considered in MINITEQ2A • Upstream Onion Creek Eh~ (-300 mV)[4] • Hematite, calcite, dolomite, and manganite at equilibrium, with SI ~ 0 • pH variation
Sorption by Hydrous Iron Oxides- Input SURFACE_SPECIES Hfo_sOH + H+ = Hfo_sOH2+ log_k 7.18 Hfo_sOH = Hfo_sO- + H+ log_k -8.82 Hfo_sOH + Zn+2 = Hfo_sOZn+ + H+ log_k 0.66 Hfo_wOH + H+ = Hfo_wOH2+ log_k 7.18 Hfo_wOH = Hfo_wO- + H+ log_k -8.82 Hfo_wOH + Zn+2 = Hfo_wOZn+ + H+ log_k -2.32
Mixing Upstream_1 pH 7.7 charge temp 11 Pe -4.69 units ppm Al 12.2 Ca 34.5 C 79 as HCO3 Cl 5 Cu .23 Fe(2) 45 Pb .14 Mg 5.2 N .1 as N03- K .95 Na 1.8 S 16 as S Zn .65 Near Mine Pit_2 pH 8.1 charge temp 12.2 Pe0 units ppm Al 23.6 Ca 75.3 C 132 as HCO3 Cl 7 Cu .75 Fe(2) 93.5 Pb 18.6 Mg 41.5 N 4.4 as N03- K .95 Na 5.2 S 183 as S Zn 153 • Model dependent upon mixing of mine runoff with Onion Creek stream • 1 yr rain storm creates 10:1 mix[8] • Water chemistry for both solutions taken from field measurements.
Mixing • MIX_1 1 10 2 1 • Based upon Onion Creek discharge = 125 cfs[8] • Rainfall drainage area = 1000 square miles [8] [9] [9]
Results PHREEQC Calculations Total Zn = 9.945X10⁻⁶Moles/L = 0.650 mg/L (Zn = 65.38 g/mole) Total Pb = 6.758X10⁻⁷Moles/L = 0.140 mg/L (Pb = 207.2 g/mole)
Results ----------Description of solution---------- pH = 8.019 Charge balance pe = 0.000 Specific Conductance (uS/cm, 12 oC) = 793 Density (g/cm3) = 1.00053 Activity of water = 1.000 Ionic strength = 2.072e-002 Mass of water (kg) = 1.000e+000 Total alkalinity (eq/kg) = 6.663e-003 Total CO2 (mol/kg) = 2.165e-003 Temperature (deg C) = 12.200 Electrical balance (eq) = -1.970e-017 Percent error= -0.00 Iterations = 11 Total H = 1.110175e+002 Total O = 5.553927e+001 ------------------------------Saturation indices------------------------------- Phase SI Al(OH)3(a) 1.25 Alunite 4.59 Anglesite -0.63 Anhydrite -1.32 Aragonite -0.23 Calcite -0.08 Cerrusite 1.96 CH4(g) -39.80 CO2(g) -3.27 Dolomite -0.25 FeS(ppt) -30.33 Gibbsite 4.06 Gypsum -1.07 H2(g) -16.04 H2O(g) -1.86 H2S(g) -39.18 Halite -9.03 Mackinawite -29.60 Melanterite -3.35 N2(g) -1.06 NH3(g) -21.33 O2(g) -55.65 Pb(OH)2 1.53 Pyrite -46.52 Siderite 2.24 Smithsonite 1.25 Sphalerite -22.39 Sulfur -29.19 Zn(OH)2(e) 1.37
VariablepH • Original paper suggests that when pH falls below 4 TE’s go back into solution • To test this pH was varied in PHREEQ model • The results are shown to the right
Errors? • Biggest source of uncertainty is mixing ratio • Oxidation potentials are approximate • Over time, adsorbed Pb, Zn may be released downstream under varying water chemistry
Discussion • Some chemicals are being discharged and transported from abandoned mine • Maximum contaminant level (MCL) for Pb = 0 • ORP potential has high impact on sorption • Mixing ratios need to be considered carefully • If ambient pH remains neutral or above neutral, TE’s will remain immobilized
References • [1]http://www.google.com/images?hl=en&q=Onion+Creek&rlz=1B3GGGL • [2]http://www.google.com/imgres?imgurl=http://craigwolf.com/news/uploaded_images/Columbia_River_Gorge • [3] INACTIVE AND ABANDONED MINE LANDS—Van Stone mine, Northport Mining District, Stevens County, Washington. Wolff, E.F.; Washington Department of Natural Resources (2005) • [4] Washington Department of Ecology (DOE) • [5] Routh J., Trace-element geochemistry of Onion Creek near Van Stone lead-zinc mine(Washington, USA) Chemical analysis and geochemical modeling (2006). Chemical Geology, 133 pg. 211-224. • [6] http://67pics.com/pictures-columbia-river-gorge.html • [7] http://www.google.com/imgres?imgurl=http://CR.Carp • [8]www.usgs.gov/precipitation/database.3993.html • [9] http://www.tripadvisor.com/LocationPhotos-g54225-html#16911511 • [10]http://www.google.com/images?hl=en&q=stevens+county+wa&rlz=1B3GGGL_enUS212US212&um=1&ie=UTF-8&source=og&sa=N&tab=wi&biw=1280&bih=805