Download
1 / 20
200 likes | 348 Views
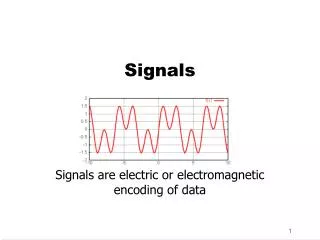
Acoustic Neutrino Signals in Rock Salt?. Rolf Nahnhauer DESY, Zeuthen. Theoretical Expectations. B.Price, see talk of J. Vandenbrouck. Water Ice Salt

E N D
Acoustic Neutrino Signals in Rock Salt? Rolf Nahnhauer DESY, Zeuthen
Theoretical Expectations B.Price, see talk of J. Vandenbrouck Water Ice Salt ρ [g/cm3] 1 .9 2.1 Vs [m/s] 1450 3800 4500 P/Pwater 1 10 25 f/fwater1 ~3 ~6 eff. absorption ~km 7 km ? (km) noise large(environmental) small ? ??? Salt seems promising as detector medium need measurements
First Measurements M. Fink et al. Univ. of Texas Information from N. Kirbys Senior Thesis 2004 Measure in Hockley salt dome at mining level P(r) = 1/r2 r = 3.64 m, 9.84 m, 19.88 m
Receiver and Transmitter Receiver: Kistler PiezotoronAE Sensor 8152 B(50-400 kHz) ! +AE Coupler 5152 Transmitter: American PiezoCeramics H = ½ inch R = 3/10 inch old coupling to salt new coupling to salt
Signal Form PRELIMINARY pressure wave dominates at 82 kHz vPs = 4337 ± 84 m/s shear wave dominates at 88 kHz vSs = 2000 ± 220 m/s
Signal Strength PRELIMINARY linear dependence A in~ A out Aout largest for fin ~62.5k Hz resonance pattern changes with distance
PRELIMINARY Signal Attenuation λatt = 1/α S = Ae-αr/rn n = 1 used but for point source n = 2 ??? would give factor ~2 linear increase of attenuation length with frequency ? but λatt ≈ 15 - 25 m at 60 -20 kHz ??
Signal Interpretation if result ok, no acoustic detector in Hockley mine at this depth • result due to salt quality, impurities etc. ? • result due to geometry of specific location, reflections etc. ? • result due to bad coupling of transmitter and/or receiver to salt ? • result due to bad impedance fitting of different detector components ? • result due to very high lower frequency cutoff of sensor ? need new measurement with other detector (gave one DESY detector to the Texas group last autumn) need probably better coupling to salt would be good to have a few test bore holes distant to mining activities
Acoustic Crack Detection in Salt and Rock learn from geophysicists, e.g. : T. Spies, D. Meister, J.Eisenblätter, Application of acoustic emissin for analyzing the geochemical behaviour of salt rock, 6th conference on Acoustic Emission /Microseismic Activity in Geology Structures and Materials, Penn. State Univ., 1996 T. Spies, J. Eisenblätter, Crack detection in rock salt and implications for the geo-mechanical situation, Mechanics of Jointed and Faulted Rock, Rossmanith (ed.)1998,Balkema, Rotterdam A. Zang et al., Fracture process zone in granite, Journal of Geophysical research V105,B10,23651, 2000T. Spies, J. Eisenblätter, Engineering geology 61 (2001)181 T. Spies, J. Eisenblätter, J.Manthei, Neue Entwicklungen in der Mikroakustik am Beispiel von Messungen im Endlager Moorsleben, Z. f. angewandte Geologie, H2, 2002, 30 Special thanks to J. Eisenblätter, who allowed to use one of hisppt-files for the followingcollection of pictures and graphs
Detector Examples f = 1 – 100 kHz, fres = 150 kHz
Search for Micro-Cracks Location of materials and mining holes in salt dome Location of 24 bore holes in the mine
Signal Form Signal from 1 crack seen by 12 detectors
Signal Strenght and Attenuation λatt = 1/α S = Ae-αr/rn n = 2 used λatt≈ 170 m !
Signal Locations observe two clusters of acoustic activity ΔLevent < 1m reason is crack formation between rock salt and anhydrite core from bore hole
Ideas at DESY Use German salt domes and salt mines for test measurements Have contacted “Bundesanstalt für Geologie und Rohstoffe”P.Hoth, P.Krull Salt domes sometimes very near to surface DESY, Hamburg DESY, Zeuthen Salt domeSperenberg < 50m from surface< 30 km from DESY drilling only : ~50 k € in total : ~250 k € Time scale: ???
Detector Development for South Pole Ice study ambient noise measure absorption length Noise limitations : Deploy ≥ 2 acoustic test strings at South Pole Depth : 300 m – 450 m Sensors : own development beam tested 12 cm glass ball 12 cm iron ball
Testruns at a Proton Beam Uppsala 19.-26.1.2003 Uppsala 14.-21.2.2004 d = 65 cm T = -25º C Etot = 5.6 PeV – 1.7 EeV x observable pressure : ~10 mPa threshold at ~1 m distanceE min 10 PeV
Detector Calibration reference hydrophone: Sensortech SQ03: -163.3±0.3 dB re 1V/μPa transmitter: piezo ceramic cylinder: r= 5mm, h=5mm water pool : 12x10x5 m3 ( to avoid early reflections) two methods: continuous sine wave, short pulses with Fourier analysis S. BöserPRELIMINARY
DESY- Detectors for Salt? present design easy to adapt to fit a salt bore hole : use “open spheres” for sensors and transmitters
Summary Chance of detection of GZK neutrinos by acoustic signals in salt domes looks promising Need more data about acoustic signal production and propagation in salt Good possibilities to do such studies in Germany DESY detectors could be used with slight modifications DESY manpower to small to start now DESY priority is acoustic detector at South Pole(combined with radio detector, both around IceCube) First IceCube string successfully deployed now