Download
1 / 18
190 likes | 322 Views
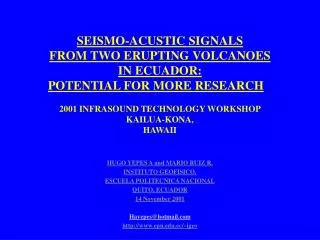
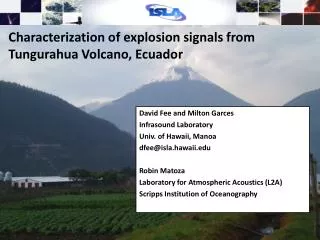
SEISMO-ACOUSTIC SIGNALS OF EXPLOSION EVENTS AT TUNGURAHUA VOLCANO, ECUADOR Mario C. Ruiz, Jonathan Lees, and Jeffrey Johnson

E N D
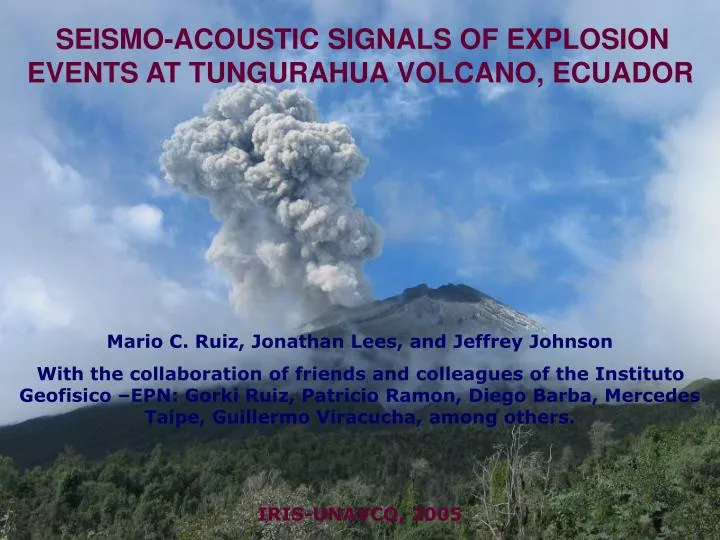
SEISMO-ACOUSTIC SIGNALS OF EXPLOSION EVENTS AT TUNGURAHUA VOLCANO, ECUADOR Mario C. Ruiz, Jonathan Lees, and Jeffrey Johnson With the collaboration of friends and colleagues of the Instituto Geofisico –EPN: Gorki Ruiz, Patricio Ramon, Diego Barba, Mercedes Taipe, Guillermo Viracucha, among others. IRIS-UNAVCO, 2005
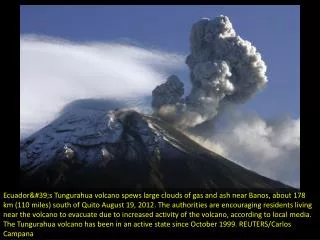
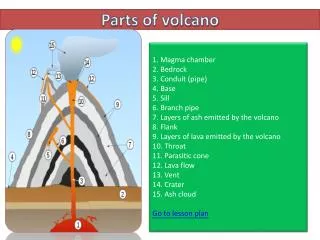
WHY TUNGURAHUA: Since 1999, Tungurahua volcano shows a persistent volcanic activity with more than 6,000 explosions. These explosions are characterized by discrete explosions with: eruptive columns less than 7 km high, ballistic ejection of blocks, generation of atmospheric shock waves, emission of tephra, and deposits that widely range in the percentage of juvenile versus non-juvenile components. Tungurahua is a young andesitic (last eruption:57-58% SiO2 ) stratovolcano (5020m) on the Real Cordillera of Ecuador, with a 500 m width crater on its upper NW flank. Tungurahua offers the opportunity for understanding the behavior of volcanic centers with andesitic composition, that are present especially along subduction zones.
1999-2004 TUNGURAHUA ACTIVITY • >6,000 explosions since October 5th, 1999. • November 1999 had largest number of explosions (1491). • Since then, 4 smaller active periods were recorded. • Last period started on May 2004. • Seismic experiment coincided with climax and tail of May-August active period.
DATA COLLECTION Three Broad-Band Seismic-Infrasound Stations: distance to vent altitude MAS 3516 m 3310 m JUI 4168 m 2965 m RUN 5889 m 2700 m Operation Period: June 29 to August 12 2004 RUN station
TUNGURAHUA DEGASSING MODES Initial Time: 0 s Time: 15 s Plume moving to W Degassing pulse Time: 60 s Time: 45 s Constant flow degassing Transition degassing phase
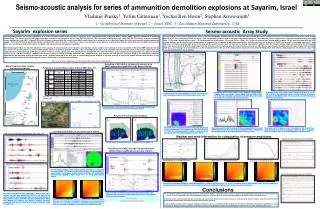
CHARACTERISTICS OF SEISMIC SIGNALS OF EX EVENTS:Non-stationary (episodic) behaviorWide range of amplitudes(three orders)Power law of amplitude distribution and time intervals for the complete set of explosions
CHARACTERISTICS OF INFRASONIC SIGNALS Non-stationary behavior Large amplitude range reaching high sound level amplitudes Most of events are related to small gas velocities at the vent. Few signal get large exit velocities EX events with clear arrivals times show a large interval range between events
Cluster 1: Sharp onsets, Quick compression, Slow rarefaction Cluster 2: Sharp onsets, Quick compression, Quick rarefaction Cluster 4: Variable onsets, Slow compression, Slow rarefaction Cluster 3: Sharp onsets, Quick compression, Slow rarefaction
CLUSTER ANALYSIS OF EX EVENTS Group 4 Group 3 Group 4 Group 2 Group 3 Group 1 Group 1 Group 2
Distribution of cluster events does not show Spatial nor Temporal CorrelationClusters do not depend on explosion location.Clusters are related to different exit modes of mixtures of gas and solids
LOCATING EVENTS USING INVERSION OF ARRIVAL TIMES OF SEISMIC EVENTS Six EX events recorded on 6-9 seismic stations, were located using Lquake software. Most of the epicenters lay around 400 m south of active vent.
LOCATING EXPLOSION SOURCES USING PARTICLE MOTION Polarization angles of horizontal seismic displacements are computed using SVD on 50 moving windows of 0.75 s, after seismic onset. Median, 5th and 95th percentiles of back-azimuths are plotted. Scaled vertical and horizontal components are plotted. Epicenters are located south of the vent.
Constraining Vp with arrivals of secondary seismic pulses and infrasonic waves TP2 TP1 Gas expansion at crater floor can generate simultaneously an infrasonic and a secondary seismic pulse (Tp1+1.77 s) traveling across parallel paths. Red line is expected curve for Vp =2.9 km/s. Dotted lines correspond to Vp deviations of 1.2 km/s. Tp1: first compressive seismic arrival from expansion at the explosion source inside the conduit Tp2: second compressive arrival observed 1.77 s later at MAS, which likely is related to gas expansion at the vent.
Constraining SOURCE DEPTH with arrival time differences: Mapping residuals for different values of U (ascending velocity in the conduit) and z (depth below crater floor) We found that events with ascending velocities smaller than 100 m/s would have source depths shallower than 120 m
Constraining SOURCE DEPTH with arrival time differences: 1.-Find statistics of delay times between acoustic and seismic arrivals 2.- Compute source depths using a constant ascending velocity U= 40 m/s, and a constant seismic velocity V=2.9 km/s (Molina, 2001) 3.- Define source area: 5-100 m below crater floor
CONCLUSIONS • Extensive degassing at Tungurahua shows a wide range of seismo-acoustic signals with three main types: EXplosions, ROars, and CHugs). More than 95% of all signals recorded at Tungurahua have an infrasonic component and, therefore, are related to different modes of degasssing. • There are at least 4 families of EXplosions events based on cluster analysis of infrasonic waveforms. These clusters do not exhibit temporal, suggesting they are related to coexisting explosive processes. • Epicenters of explosion events are located in two areas: inside the crater and <400 m south of active crater. Network geometry do not allow precise locations of explosion sources. • Remarkable delay times between seismic and infrasonic signals are observed at all stations. Wind, temperature or humidity variations are not likely the main factor. Analysis of these delay times help to constrain the region source of EX events at depths ranging from 5 to 100 m inside the conduit.