Download
1 / 17
300 likes | 574 Views
Geometric Distribution. A probability distribution to determine the probability that success will occur on the nth trial of a binomial experiement. Geometric Distribution. Repeated binomial trials Continue until first success Find probability that first success comes on nth trial

E N D
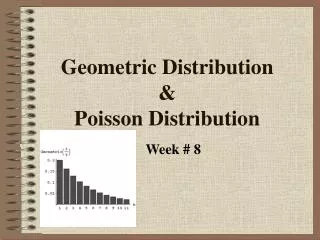
Geometric Distribution A probability distribution to determine the probability that success will occur on the nth trial of a binomial experiement
Geometric Distribution • Repeated binomial trials • Continue until first success • Find probability that first success comes on nth trial • Probability of success on each trial = p
A sharpshooter normally hits the target 70% of the time. • Find the probability that her first hit is on the second shot. • Find the mean and the standard deviation of this geometric distribution.
A sharpshooter normally hits the target 70% of the time. • Find the probability that her first hit is on the second shot. • P(2)=p(1-p) n-1 = .7(.3)2-1 = 0.21 • Find the mean • = 1/p = 1/.7 1.43 • Find the standard deviation
Poisson Distribution A probability distribution where the number of trials gets larger and larger while the probability of success gets smaller and smaller
Poisson Distribution • Two outcomes : success and failure • Outcomes must be independent • Compute probability of r occurrences in a given time, space, volume or other interval • (Greek letter lambda) represents mean number of successes over time, space, area
The mean number of people arriving per hour at a shopping center is 18. • Find the probability that the number of customers arriving in an hour is 20. r = 20 = 18 Find P(20) e = 2.7183
The mean number of people arriving per hour at a shopping center is 18.
Poisson Probability Distribution Table Table 4 in Appendix II provides the probability of a specified value of r for selected values of .
Using the Poisson Table • = 18, find P(20):
Poisson Approximation to the Binomial Distribution The Poisson distribution can be used as a probability distribution for “rare” events.
“Rare” Event The number of trials (n) is large and the probability of success (p) is small.
If n 100 and np < 10, then • The distribution of r (the number of successes) has a binomial distribution which is approximated by a Poisson distribution . • The mean = np.
Use the Poisson distribution to approximate the binomial distribution: • n = 240 • p = 0.02 • Find the probability of at most 3 successes.
Using the Poisson to approximate the binomial distribution for n = 240 and p = 0.02 Note that n 100 and np = 4.8 < 10, so the Poisson distribution can be used to approximate the binomial distribution. Find the probability of at most 3 successes: Since = np = 4.8, we use Table 4 to find P( r 3) =.0082 + .0395 + . 0948 + . 1517 = .2942