Download
1 / 3
30 likes | 186 Views
OLS versus MLE Example. Here is the data:. OLS versus MLE Example. Here is the SAS code:. OLS fitting using PROC GLM:. proc glm data=data; model y = x; run ;. Call the procedure for data set “data” Regression model: y = b 0 + b 1 x. MLE fitting using PROC GENMOD:.

E N D
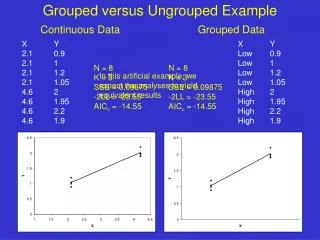
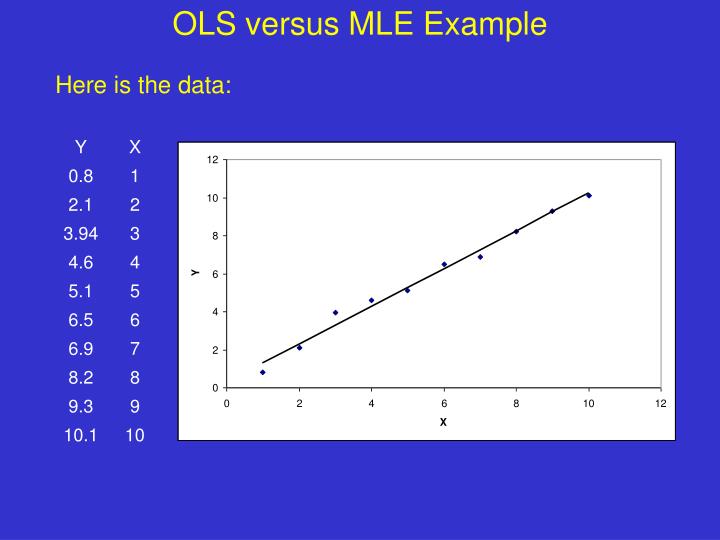
OLS versus MLE Example Here is the data:
OLS versus MLE Example Here is the SAS code: OLS fitting using PROC GLM: procglm data=data; model y = x; run; Call the procedure for data set “data” Regression model: y = b0 + b1x MLE fitting using PROC GENMOD: Call the procedure for data set “data” Model: y = b0 + b1x Assume normally distributed errors Use an identity link (the link function describes the relationship between y and the linear portion of the model) procgenmod data=data; model y = x / dist=normal link=identity; run;
OLS versus MLE Example Output from PROC GLM Output from PROC GENMOD Source DF SS Mean Sq Model 1 81.2051 81.2051 Error 8 1.0533 0.1316 Corrected Total 9 82.2584 R-Square Root MSE 0.987195 0.362857 Parameter Estimate SE Intercept 0.297333 0.2478 X 0.992121 0.0399 Criterion DF Value Value/DF Deviance 8 1.0533 0.1317 Scaled Deviance 8 10.0000 1.2500 Log Likelihood -2.9362 Parameter DF Estimate SE Intercept 1 0.2973 0.2217 X 1 0.9921 0.0357 Scale 1 0.3245 0.0726 MLE s2 = SS/n = 0.10533 Scale = f = (s2)2 Note that SE estimates differ; MLE variance estimates are biased at low sample sizes Ln(L) = -n/2*ln(2pes2) = -5ln(17.07947*0.10533) = -2.9361 K = 3 (intercept, x, s) K = 3 (intercept, x, scale)