Download
1 / 21
210 likes | 394 Views
Indicators for the Washington Innovation Economy. Paul Sommers, Seattle University Andrew Wenzl , University of Washington William Beyers, University of Washington Report for the Washington Economic Development Commission, June 2010 Presentation Version for LMEA Conference, October 2010.

E N D
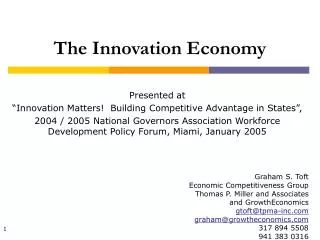
Indicators for the Washington Innovation Economy Paul Sommers, Seattle UniversityAndrew Wenzl, University of WashingtonWilliam Beyers, University of Washington Report for the Washington Economic Development Commission, June 2010 Presentation Version for LMEA Conference, October 2010
What this presentation is about Virginia • Consulting team hired to create a “dashboard” – a system of indicators that could be used to assess Washington’s progress in creating a healthy innovation-based economy • RFP called for indicators in five areas organized in a model of innovation, and for comparisons of Washington to other states and nations • Major conclusions: • More than one path to success is apparent • We import talent but have a strong workforce; we could decide to grow more of our own in selected areas • There are weaknesses in each of the input dimensions that could be improved • It is not necessary (or even possible) to be best at everything • We have strong business performance but are not turning that into as much broad based public impact as some other states – possible implications for public policy here • Suggested extensions of the work: • Investigate alternative weighting systems and their implications • Use indicators for POG goals & cluster strategies • Focus policy on improvements on selected indicators • Explore innovation models (policies, industrial base, and outcomes) in peer states
Peer States Chosen Based on Similarities in Industry Structure (5 peers chosen from initial list of 15 states) Location Quotients
EDC Model of Innovation’s Economic Impact Business performance determines public impacts Three kinds of inputs influence business performance
22 Indicators Organized in 5 Broad Categories Fact Sheet for each indicator shows the trend in Washington, a comparison with peer states, and a comparison of the U.S. to selected other nations
Example Fact Sheet (1 of 22 in the report)Science and Engineering Degrees Granted Science and Engineering Degrees Granted, 1997 to 2002 Science and Engineering Degrees Granted by Washington’s Higher Education Institutions, 1997 to 2007 • Technological progress depends on presence of scientists and engineers in the workforce • Improvement from 1997 to 2002, but a sharp drop from 2002 to 2007 in Washington and peer states • U.S. produces as many science and engineering graduates as a proportion of all university degrees as five other nations, but a much lower level than So. Korea and Sweden, and somewhat less than several European countries • Data source: National Science Foundation Science and Engineering Graduates by Country (as percentage of all first university and doctoral degrees)
The Other 21 Fact Sheets Detailed fact sheets are provided in the report at the WEDC website: http://www.wedc.wa.gov/Publications.htm The focus in this presentation is on findings at the broad category level
Composite ScoresAll 5 Broad Indicators – The Dashboard Composite scores created by indexing each indicator and combining indicators into a composite for each of the five broad indicators; the five broad indicator composites are then combined into an overall composite “dashboard” indicator shown on this slide Virginia The overall composite measure shows Washington performing well below California, Connecticut, and Massachusetts, in a similar range to Colorado, and ahead of Virginia
6 5 Talent 4 Investment 3 Infrastructure Business_Performance 2 Public_Impact 1 0 Colorado California Virginia Washington Connecticut Massachusetts Composite Scores by 5 Broad Components • Washington has low scores on talent, investment, and public impact; we do well on business performance and infrastructure • Colorado reaches a similar overall score in a very different manner, almost the reverse of the pattern in Washington • The high performing states (CA, CT, and MA) also have different patterns on the five broad components • There are different strategies available for success in the innovation economy
Talent Composite Virginia Washington is in last place on the talent index
6 5 Education Pipeline 4 Workforce Quality 3 R&D Personnel 2 Stem Proficiency 1 0 Virginia Colorado California Connecticut Washington Massachusetts Talent Components Washington has relatively low scores for the education pipeline, R&D personnel, and STEM proficiency, but does better on workforce quality
Investment/Entrepreneurship Composite Virginia Washington is fifth among the six peer states on this composite indicator
6 5 R&D Intensity 4 Business Startups 3 Inward Investment 2 Capital Access 1 0 Virginia Colorado California Connecticut Washington Massachusetts Investment/Entrepreneurship Components Washington scores relatively poorly on inward investment and capital access, relatively well on R&D intensity, and in the middle on business startups
Infrastructure Virginia Washington is in second place on this composite indicator
6.00 5.00 Business Climate 4.00 Transportation 3.00 Broadband Energy 2.00 Sustainability 1.00 0.00 Colorado California Virginia Connecticut Washington Massachusetts Infrastructure Components Washington has high scores on three of the five indicators: business climate, transportation, and broadband
Business Performance Virginia Washington has the highest score on this indicator
6 5 4 Productivity 3 Exports Market Capitalization 2 1 0 Virginia Colorado California Connecticut Washington Massachusetts Business Performance Components Washington has a high score on exports, and very good position on market capitalization and productivity
Public Impact Virginia Washington’s overall public impact score is low, below all peer states except California.
6 5 State GDP 4 Employment Growth 3 State Revenues Standard of Living 2 Income Distribution 1 0 Virginia Colorado California Washington Connecticut Massachusetts Public Impact Components Washington has high scores on state GDP and employment growth, but lower scores on state revenues, income distribution, and standard of living
Other index reports such as Atkinson’s State New Economy Index do not give equal weight to each variable; equal weights are used in all charts in this presentation except the two on this page We used example arbitrary weights; the ranking of state scores is unchanged for the dashboard, but for the talent index, the ranking of states shifts considerably The EDC could explore alternative weights, for example weighting inputs more than outputs, or the other way around, or giving greater weight to individual variables considered especially important 6 5 4 Average Score 3 Weighted Score 2 1 0 Virginia Colorado California Connecticut Washington Massachusetts Weighting the Variables The Dashboard Weighted and Not Weighted Virginia Colorado California Connecticut Washington Massachusetts The Talent Composite Index Weighted and Not Weighted
Major Conclusions • Major conclusions: • More than one path to success is apparent • We import talent but have a strong workforce; we could decide to grow more of our own in selected areas • There are weaknesses in each of the input dimensions that could be improved • It is not necessary (or even possible) to be best at everything • We have strong business performance but are not turning that into as much broad based public impact as some other states – possible implications for public policy here • Suggested extensions of the work: • Investigate alternative weighting systems • and their implications • Use indicators for POG goals & cluster strategies • Focus policy on improvements on selected indicators • Explore innovation models (policies, industrial base, and outcomes) • in peer states