Download
1 / 35
350 likes | 463 Views
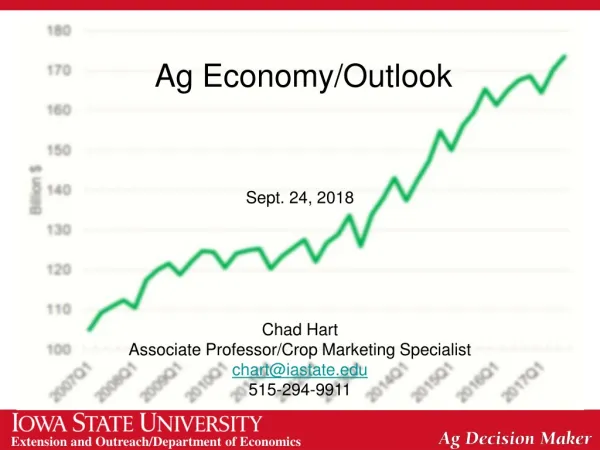
Dulles Area Transportation Association Dulles Corridor Rail Association. The Washington Area Economy and Outlook. Stephen S. Fuller, PhD Dwight Schar Faculty Chair and University Professor Director, Center for Regional Analysis School of Public Policy, George Mason University. March 30, 2006.

E N D
Dulles Area Transportation Association Dulles Corridor Rail Association The Washington Area Economy and Outlook Stephen S. Fuller, PhDDwight Schar Faculty Chair and University ProfessorDirector, Center for Regional Analysis School of Public Policy, George Mason University March 30, 2006
Annual Job Change1991 – 2005Washington Metro Source: BLS, CRA
Annual Job ChangeWashington MSA THOUSANDS Jan = +66,900
Annual Change of Employed ResidentsWashington MSA THOUSANDS Dec = +98,300 Source: BLS Household Survey
Metro Comparisons Job Change 1999-200515 Largest Metro Areas Thousands WASHINGTON Northern Virginia
15 Largest Job MarketsJob Change in 2005 Thousands Washington +64,700
15 Largest Job MarketsRanked by Unemployment RateJanuary 2006 % U.S. 5.1% 3.1 Data not seasonally adjusted
2004 - 2005 Job Change By Sector Washington MSA(000s) Total = 64,700 (Ranked by Size of Sector)
Share of Washington Area Economy1970-2005 No. Virginia % of GRP Sub MD District Year
Total Federal Spending Washington Metro Area $ Billions 2005 = $117.2 B, + 8.3%
Federal Spending by Type1983 - 2004 Billions Current $ 2005 = $59.2 B Procurement Wages & Salaries All Other
Annual Change in Federal Procurement Spending Washington Metro Area $ Billions 8.0 2005 = + $6.6 B 6.1
Federal Spending in 2004:U.S. and Washington MSA($ in billions) TOTAL PROCUREMENT 68.6% of the 2003-2004 increase in Federal Procurement nationally was in the Washington MSA Source: US Census, GMU Center for Regional Analysis
The Washington Area Housing Market
Housing Price IndexWashington PMSA4th Quarter Each Year 1995 Q1=100 1997-2005 = +153 % 1990-1997 =+ 3.7 % Source: Federal Office of Housing Enterprise Oversight, GMU Center for Regional Analysis
Housing Price IndexAnnual % ChangeWashington PMSA4th Quarter Each Year 1995 Q1=100 28-Yr Average (compound rate) = 7.0% Source: Federal Office of Housing Enterprise Oversight, GMU Center for Regional Analysis
Metro Comparisons Annual Percent Change in House Prices 2004 –2005(3rd Quarter) Percent WASHINGTON Conforming Mortgages Only Source: Office of Federal Housing Enterprise Oversight, GMU Center for Regional Analysis
Metro Comparisons Ratio of Median Value of New Housing toMedian Family Income – Q3 2005 WASHINGTON In 2000 Washington was 2.8 Source: NAHB/Wells Fargo, GMU Center for Regional Analysis
Average Sales PriceAll Housing TypesWashington Metro + 119% Since 1999 $ +5.8% +10.5% +13.6% +13.8% +20.1% +21.7% Source: MRIS, GMU Center for Regional Analysis
Average Sales Price Percent ChangeMonth-over-the-year, All types 2004-2005-2006Washington MSA %
Average Days on the Market ChangeMonth-over-the-year, All Types 2004-2005-2006Washington MSA 37 21 59
Total Unit Sales ChangeMonth-over-the-year, All Types 2004-2005-2006Washington MSA %
Average = 31,400/Year MSA Total Housing Unit Permits 1980 - 2005 Projected Demand 2005-2007 Year
Dulles Corridor - FairfaxEmployment & Household Forecast Growth, 2005 - 2030 THOUSANDS Source: COG Round 7, CRA
Dulles Corridor - Loudoun Employment & Household Forecast Growth, 2005 - 2030 THOUSANDS Source: COG Round 7, CRA
Dulles Corridor - Fairfax& Loudoun Employment & Household Forecast Growth, 2005 - 2030 THOUSANDS Source: COG Round 7, CRA
Economic Outlook (GRP) – 2010Washington Area and Sub-state Portions(Annual % Change) % NV MSA SM DC
Employment Change bySub-state Region (000s) (1) 1995-2005
Housing Outlook for 2006 and 2007 Market will continue to cool – returning to “more Normal’: • 2006 Prices will increase in the range of 6% – 12% compared with 20+% in 2005 • Sales volume will drop back to 2002-2003 levels (98-100,000 transactions) • Days on Market rising to 45-55 average
Local Threats to the Forecast • Global / National Forces • Labor Force Availability, Quality and Cost • Transportation Cost / Congestion • Federal Spending and Procurement Policy • BRAC • Housing Affordability and Supply