Download
1 / 21
220 likes | 333 Views
THE EIGHT ECONOMIC REGIONS OF CHINA. The Eight Economic Regions of China. A. National Economy – Misleading

E N D
The Eight Economic Regions of China • A. National Economy – Misleading • A decade ago, to talk about China’s national economy was seriously misleading. It was really a series of provincial economies, which traded little with each other, let alone the outside world. Everywhere had its own set of factories producing a similar set of goods – hence the hundreds of car plants, steel mills, cement works and so on across the country. The biggest reason for this was the lack of transport infrastructure, and even today, China has fewer miles of railway than the US had at the time of its civil war in the 1860s. As such, the country is still basically a set of regional economies. • B. Regional Economies – Methodology • Fiducia has grouped China’s provinces into regions based on the following statistical and non-statistical criteria: • administrative provinces • population density • GDP, per capita GDP and long-term GDP growth • per capita disposable income • For each statistical criterion, the provinces were given percentage rankings, and the rankings weighted according to the relative importance of the criterion. Then for each province, the weighted rankings were summed across all statistical criteria, and the results plotted in gray scale on a map of the Chinese provinces. The patterns which emerged were cross-referenced with the non-statistical criteria, and the regional economies determined. • trade value and per capita trade value • FDI and per capita FDI • infrastructure • tradition, culture and dialect
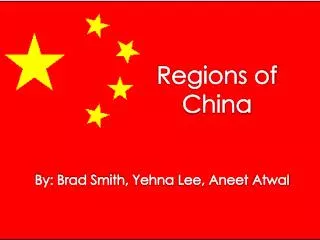
Central • Hubei • Hunan • Henan • Anhui • Jiangxi • Shanxi The Eight Economic Regions of China C. Regional Economies – Eight in Total China has eight economic regions: Greater Beijing, Greater Shanghai, Greater Guangdong, Central, Northeast, Northwest, West and Southwest. • Northeast • Heilongjiang • Jilin • Liaoning • Northwest • Xinjiang • Gansu • Ningxia • Shaanxi • Inner Mongolia • Greater Beijing • Beijing • Tianjin • Hebei • Shandong • West • Tibet • Qinghai • Southwest • Sichuan • Yunnan • Guizhou • Guangxi • Chongqing • Greater Shanghai • Shanghai • Jiangsu • Zhejiang • Greater Guangdong • Guangdong • Fujian • Hainan • (Hong Kong) • (Taiwan)
The Eight Economic Regions of China • D. Regional Economies - Strategy Development • ‘The Eight Economic Regions of China’ displays the diversity between these regions in the series of thematic maps which follow. Recognising and understanding the diversity between these regions, and thereby avoiding the pitfalls of generalisation, is fundamental to developing a workable strategy in China: • It is the first step in determining where to focus business activities, for example, investment locations or target markets. As such, ‘The Eight Economic Regions of China’ indicates which regions should be further investigated, and which regions should be ruled out for the time being. • As the diversity between regions is not static, it is important to consider both the current levels of diversity, and the growth rates of each region. As such, ‘The Eight Economic Regions of China’ also suggests which regions have the greatest future potential, and which regions have reached more mature stages.
* Excluding Hong Kong and Taiwan: • Hong Kong’s population (in 10,000s) is 672 • Taiwan’s population (in 10,000s) is 2,193 1. Population (10,000s) 1999 10,621 YoY Growth: 0.4% 10,240 YoY Growth: -4.7% 17,713 YoY Growth: 0.6% 766 YoY Growth: 1.5% 35,529 YoY Growth: 0.7% 13,162 YoY Growth: 0.5% 24,239 YoY Growth: 0.9% Key: Regions are shaded according to year-on-year growth, the regions with the highest growth are shaded most heavily, and the regions with the lowest growth are shaded most lightly. 11,348* YoY Growth: 1.4% Source: China Statistical Yearbook
2. Population Density (People Per Sq Mile) 1999 342 YoY Growth: 0.4% 76 YoY Growth: -4.7% 1,236 YoY Growth: 0.6% • * Excluding Hong Kong and Taiwan: • Hong Kong’s population density (in people per sq mile) is 15,924 • Taiwan’s population density (in people per sq mile) is 1,579 (1998) 10 YoY Growth: 1.5% 1,619 YoY Growth: 0.5% 897 YoY Growth: 0.7% 458 YoY Growth: 0.9% Key: Regions are shaded according to year-on-year growth, the regions with the highest growth are shaded most heavily, and the regions with the lowest growth are shaded most lightly. 885 YoY Growth: 1.4%* Source: China Statistical Yearbook
* Excluding Hong Kong and Taiwan: Hong Kong’s GDP (in 100 millions) is 13,180 RMB Taiwan’s GDP (in 100 millions) is 21,933 RMB (1998) 3. GDP (100 million RMB) 1999 8,739 YoY Growth: 6% 5,099 YoY Growth: 7% 15,855 YoY Growth: 7% 344 YoY Growth: 11% 17,098 YoY Growth: 8% 18,140 YoY Growth: 4% Regions are shaded according to year-on-year growth, the regions with the highest growth are shaded most heavily, and the regions with the lowest growth are shaded most lightly. 9,913 YoY Growth: 4% Note: Gross Domestic Product refers to the final products of all resident units in a country during the given period of time. 12,485* YoY Growth: 7% Source: China Statistical Yearbook
* Excluding Hong Kong and Taiwan: Hong Kong’s per capita GDP is 196,137 RMB Taiwan’s per capita GDP is 100,014 RMB (1998) 4. Per Capita GDP (RMB) 1999 8,228 YoY Growth: 5% 8,951 YoY Growth: 7% 4,979 YoY Growth: 12% 4,491 YoY Growth: 9% 12,990 YoY Growth: 7% 5,106 YoY Growth: 3% Key: Regions are shaded according to year-on-year growth, the regions with the highest growth are shaded most heavily, and the regions with the lowest growth are shaded most lightly. 4,090 YoY Growth: 3% 11,002* YoY Growth: 5% Note: Gross Domestic Product refers to the final products of all resident units in a country during the given period of time. Source: China Statistical Yearbook
* Excluding Hong Kong and Taiwan ** Excluding Tibet 5. Total GDP Growth (%) 1991 - 1999 377 352 479 340** Key: Regions are shaded according to growth, the regions with the highest growth are shaded most heavily, and the regions with the lowest growth are shaded most lightly. 587 412 364 565* Note: Gross Domestic Product refers to the final products of all resident units in a country during the given period of time. Source: China Statistical Yearbook
6. Per Capita Disposable Income of Urban Residents (RMB) 1999 4,686 YoY Growth: 7% 4,696 YoY Growth: 9% 5,982 YoY Growth: 7% * Excluding Hong Kong and Taiwan 7,673 YoY Growth: 11% 5,440 YoY Growth: 12% Key: Regions are shaded according to year-on-year growth, the regions with the highest growth are shaded most heavily, and the regions with the lowest growth are shaded most lightly. 4,981 YoY Growth: 8% 5,597 YoY Growth: 6% Note: Disposable Income of Urban Residents refers to the income of households which can be used for daily expenses, i.e. total income minus taxes and other current transfers. 8,209* YoY Growth: 4% Source: China Statistical Yearbook
7. Actually Used FDI (100 million RMB) 1999 140 YoY Growth: -46% 35 YoY Growth: -10% 584 YoY Growth: -11% * Excluding Hong Kong and Taiwan ** Excluding Tibet Key: Regions are shaded according to year-on-year growth, the regions with the highest growth are shaded most heavily, and the regions with the lowest growth are shaded most lightly. 0.5** YoY Growth: N/A 254 YoY Growth: -10% 842 YoY Growth: -12% Note: Foreign Direct Investment refers to the investments inside China made by foreign enterprises, economic organisations and individuals (including overseas Chinese, Hong Kong Chinese and Chinese enterprises registered abroad) for the establishment of WFOE’s, JV’s and COE’s. 117 YoY Growth: -25% 1,342* YoY Growth: -5% Source: China Statistical Yearbook
8. Per Capita Actually Used FDI (RMB) 1999 131 YoY Growth: -47% 34 YoY Growth: -6% 330 YoY Growth: -12% * Excluding Hong Kong and Taiwan ** Excluding Tibet Key: Regions are shaded according to year-on-year growth, the regions with the highest growth are shaded most heavily, and the regions with the lowest growth are shaded most lightly. 7** YoY Growth: N/A 640 YoY Growth: -13% 72 YoY Growth: -10% Note: Foreign Direct Investment refers to the investments inside China made by foreign enterprises, economic organisations and individuals (including overseas Chinese, Hong Kong Chinese and Chinese enterprises registered abroad) for the establishment of WFOE’s, JV’s and COE’s. 48 YoY Growth: -26% 1,182* YoY Growth: -6% Source: China Statistical Yearbook
9. Value of Import and Export (100 million RMB) 1999 1,505 YoY Growth: 11% 481 YoY Growth: 11% 5,794 YoY Growth: 13% * Excluding Hong Kong and Taiwan: Hong Kong’s trade value (in 100 millions) is 29,554 Taiwan’s trade value (in 100 millions) is 17,928 (1998) Key: Regions are shaded according to year-on-year growth, the regions with the highest growth are shaded most heavily, and the regions with the lowest growth are shaded most lightly. 23 YoY Growth: 16% 965 YoY Growth: 6% 7,319 YoY Growth: 22% Note: Value of imports and exports is measured by location of Foreign Trade Managing Units. This refers to the actual value of imports and exports carried out by corporations which have been registered by the local custom house and are vested with the right to run trade businesses. 634 YoY Growth: -2% 13,212* YoY Growth: 7% Source: China Statistical Yearbook
10. Per Capita Value of Import and Export (RMB) 1999 1,417 YoY Growth: 10% 469 YoY Growth: 16% 3,271 YoY Growth: 12% * Excluding Hong Kong and Taiwan: Hong Kong’s per capita trade value is 439,785 RMB Taiwan’s per capita trade value is 90,483 RMB (1998) Key: Regions are shaded according to year-on-year growth, the regions with the highest growth are shaded most heavily, and the regions with the lowest growth are shaded most lightly. 297 YoY Growth: 14% 272 YoY Growth: 5% 5,561 YoY Growth: 21% Note: Value of imports and exports is measured by location of Foreign Trade Managing Units. This refers to the actual value of imports and exports carried out by corporations which have been registered by the local custom house and are vested with the right to run trade businesses. 262 YoY Growth: -3% 11,642* YoY Growth: 6% Source: China Statistical Yearbook
11. China Topographic Map (Including Provinces and Capitals)
15. China Waterways Map(Including Navigable Rivers, Ports and Sea Routes) Heilong Jiang (Black Dragon River) To Vladivostok Dalian Beijing Tianjin Huang He (Yellow River) Yantai Da Yunhe (Grand Canal) Qingdao To Nagasaki Shanghai Chang Jiang (Yangtze River) Hangzhou To Yokohama Ningbo Fuzhou Zhu Jiang (Pearl River) Xiamen Kaohsiung Hong Kong Yarlung Zangbo Jiang (Brahmaputra River) Zhanjiang To Manila, Sydney…. Lancang Jiang (Mekong River) To Singapore, Jakarta, Bangkok…