Download
1 / 67
670 likes | 932 Views
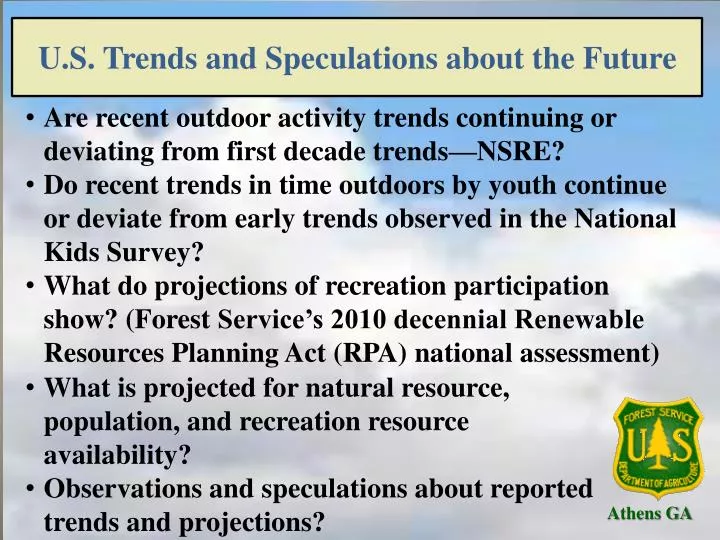
U.S. Trends and Speculations about the Future. Are recent outdoor activity trends continuing or deviating from first decade trends—NSRE? Do recent trends in time outdoors by youth continue or deviate from early trends observed in the National Kids Survey?

E N D
U.S. Trends and Speculations about the Future • Are recent outdoor activity trends continuing or deviating from first decade trends—NSRE? • Do recent trends in time outdoors by youth continue or deviate from early trends observed in the National Kids Survey? • What do projections of recreation participation show? (Forest Service’s 2010 decennial Renewable Resources Planning Act (RPA) national assessment) • What is projected for natural resource, population, and recreation resource availability? • Observations and speculations about reported trends and projections? Athens GA
Athens GA Research Connections • Connections---The current research we report here has a number of connections to past research • Surveys---FEVS, PARVS, IMPLAN for Recreation, NRS, CUSTOMER and NVUM • Partners have included UGA, UT, NOAA, NASPD, States, ERS, EPA, COE, NPS, NFS, BLM, CRS, ….. • Work with these partners led to the NSRE and the National Kids Survey (NKS) • Much of the research has been tied to FS RPA national assessment
NSRE • National RDD survey • Started 1960 • Continuous since 1999 • Last birthday • 140,000+ • Survey’s contain: • Core modules (recreation & demographics) • 2-3 others modules • Data is weighted (using Census) • National, regional, state & within state strata
National Kids Survey • September 2007 through spring 2012 • Build a national baseline about kid’s time and activities outdoors • Without a baseline, one cannot monitor trends • The National Kids Survey is a companion to the National Survey on Recreation and the Environment The NSRE is a general population survey of 16+ • A proxy household member 20 or older represented kids 6-15 • Teens 16 to 19 interviewed directly • More than one child in household, the one with the last birthday was selected
The RPA Assessment • The Forest and Rangeland Renewable Resources Planning Act (RPA) of 1974 mandates that every 10 years: • national assessment of conditions/trends of natural resources • all forest and rangelands, public and private • A snapshot of current U.S. forest and rangeland conditions and trends; identifies drivers of change; 50+ scientists w. shared databases, and projects 50 years into the future (2010-2060) • The Assessment includes outdoor recreation, fish/wildlife, wilderness, forests, water, range, urban forests, and potential impacts of climate change on resources http://www.fs.fed.us/research/rpa/2010rpa
Published research from Athens Group for the 2010 Assessment: • County Population Projections by scenario • Recreation Demand Trends and Futures in the U.S. and its regions to 2060 • Natural Amenity Effects on Rural Population Migration in the U.S. • Recreation & Protected Land Resources & Futures • Participation Projections Trends and Futures
What had we been reporting as Population and Recreation Trends? Change in persons per square mile since 1990
Demographic Change Influences • Consistent with existing outdoor rec literature • Black (neg) • Native American (pos) • Asian (neg) • Hispanic (neg) – except for Day Hiking • Educ (neg) – consumptive & motor activities • Educ (pos) – nonconsumptive & challenge • Income (pos) – most activities • Gender – boys still play more outside • Population density (neg) – crowding or urban effect? • Resource availability (positive) • Climate (generally negative) Hells Canyon WA, Sonja and Matt Reeves, April 2012
Nature-based Outdoor Recreation Growth (number of people & annual participation days, 2000–2009)
Current Situation and Trends Recent Recreation Activity Trends http://www.srs.fs.usda.gov/pubs/40453
Wildlife Watching 1996-2006 (population 16 years or older, numbers in millions) Source: U. S. Fish and Wildlife Service
What is the Outdoor Foundation Survey Showing? Outdoor Recreation Participation Report 2011 • General Findings • More young people got outside • Most significant increases were females, African Americans, and Hispanics • More adult participants than non-participants had had physical education or outdoor experience as youth, 60 percent versus 21 percent Source: Outdoor Foundation
From the Physical Activity Council 2012 Participation Report and the Outdoor Industry Association® (OIA): • Outdoor activities were the only onesout of 119 to see an increase in overall participation. • Participation in outdoor activities, like camping and hiking, rose 2 percent • Overall participation in sports, fitness and related physical activities leveled off or slightly dropped from 2010 to 2011 • Core participants, those who participate on a regular or frequent basis, remained steady for outdoor activities • The number of “inactives”, none of the 119 activities — rose to 68.1 million, or 24 percent • For inactives, camping, hiking and running are among the top activities they aspire to undertake. Fishing and canoeing are also among “aspirational sports”
Participation in Passive Outdoor Activities All Americans, Ages 6 and Older How many days in 2010 did you participate in passive outdoor activities, such as picnicking, unstructured play time, visiting a community park, kite flying, lunch outdoors at a park bench or a short walk at lunch? 57.8days average annual number of passive outdoor outings per outdoor participant 37.1days average annual number of passive outdoor outings per outdoor non-participant Source: Outdoor Foundation
Greatest One-year Change (2009-10, Age 6 through adults) Source: Outdoor Foundation
Five-Year Trend Source: Outdoor Foundation
Participation in Gateway Activities 5-Year Change Source: Outdoor Foundation
Use of Information Technology in Outdoor Recreation Source: Outdoor Foundation
Percent participating in activities favored more by Non-Hispanics NSRE Aug 2009 – Oct 2011
Percent participating in activities favored by Hispanics NSRE Aug 2009 – Oct 2011
And how about Kids Participation?Up? Down? What is the Trend? • National Kids Survey (Forest Service, University of Tennessee and University of Georgia) • Outdoor Foundation Participation Survey “Are the trends reported previously continuing, or is there deviation?” In collaboration with Susan Schexnayderand Mark Fly(Associate Director and Director, Human Dimensions Research Lab, University of Tennessee)
Percent of Youth 6 to 19 by time outdoors per day on weekdays and weekend days (2007-2012)
Average time outdoors in minutes per day by participation in sports NKS Team sports = playing or practicing team sports such as soccer baseball, field hockey or football Other sports = playing other sports such as tennis, golf, archery, or yard games
Proportion of time outdoors spent in places that are mostly natural by gender NKS Places that are mostly natural: in a woods or meadow, at a river or pond, at a nature center or on a greenway trail, or at a park.
Percentage of youth by age and by amount of time in natural places NKS Places that are mostly natural: in a woods or meadow, at a river or pond, at a nature center or on a greenway trail, or at a park.
Percentages of Youth 6-19 by activity and gender NKS Other activities surveyed include boating, jet skiing, water skiing, rowing, kayaking, canoeing, surfing, snow skiing, snowboarding, cross-country skiing, etc.
Females with highest percentages spending less than 1/2 hour, and lowest percentages spending 2 or more hours on weekend days NKS
Age and sex with highest percentages spending less than 1/2 hour, and lowest percentages spending 2 or more hours outdoors on weekdays NKS
Week days — Trend in percentage of youth 6-19 by time outdoors across 4 data collection periods NKS Data collection periods were September 2007 to July 2008; August 2008 to April 2009; May 2009 to September 2010; and October 2010 to March 2012.NONE = 0 to less than ½ hour per day.
Weekend days — Trend in percentage of youth 6-19 by amount of time outdoors on weekend days across 4 data collection periods NKS Data collection periods were September 2007 to July 2008; August 2008 to April 2009; May 2009 to September 2010; and October 2010 to March 2012. NONE = 0 to less than ½ hour per day.
Trend in percentage of youth 6-19 spending time outdoors on weekend and on week days by time period NKS Footnote---Aiken and Harris (FWS) found a 15-year modest up-trend in youth hunting participation Data collection periods were September 2007 to July 2008; August 2008 to April 2009; May 2009 to September 2010; and October 2010 to March 2012.
Trend in average minutes outdoors per day, weekdays and weekend days across 4 time periods NKS Data collection periods were September 2007 to July 2008; August 2008 to April 2009; May 2009 to September 2010; and October 2010 to March 2012.
Trend in average hours of per week outdoors per person by males and females across 4 time periods NKS NKS Data collection periods were September 2007 to July 2008; August 2008 to April 2009; May 2009 to September 2010; and October 2010 to March 2012.
Outdoor activities offering potentials for connecting with late teenage youth NKS
Youth Participation—Outdoor Foundation Survey • Participation by 6-12 year olds did not fall • Adolescents and young adults grew 1 percent • Female participation grew, those 18-24 by 5 percent • Parents with children participate more, 52 percent versus 46 percent without children • Overall, participation rates for young people stopped falling because • 6-12 year olds remained level • 13-17 year olds grew from 60 to 62 percent Source: Outdoor Foundation
What Motivates Youth Participants to Get Outside? Photo by Babs McDonald 2012 Source: Outdoor Foundation
Youth Use of I/T Technology Source: Outdoor Foundation Photo by Babs McDonald 2012
Forecasts---Recreation Demand J.M. Bowker, H. Ken Cordell, Carter Betz, and Stan Zarnoch, Southern Research Station Ashley Askew and Lynn Seymour, UGA Dept of Statistics 2010 RPA Assessment Roll-Out Briefing
Objectives Develop household-based models of recreation participation and consumption (days) • 17 popular outdoor activities or aggregates • National level • Forecast activity participation and consumption 2008 - 2060 • 3 RPA Future Scenarios with climate alternatives: • Population growth • Demographic change • Economic growth • Land use change • …and 4 Climate alternatives for each
Data NSRE FS/UGA/UT (1999-2009) • 90,000+ potential observations • Household-based • Post-sample weighted • Demographic variables RPA Supply variables • Recreation variables (various sources compiled by Cordell FS, NORSIS, wilderness.net, etc.) • Dave Wear RPA land use projections for A1B, A2, B2 RPA Forecasts and Woods & Poole • Economic data • Population Forecasts (Zarnoch and Cordell) • Climate Data---Linda Joyce RPA Prism, Various Simulations 2010 RPA Assessment Roll-Out Briefing
Days • Model Step • Hurdle Model Prob part * mean days per participant • E(Daysk ) = Probk * Daysk (Days>0) • SD= age, ethnicity, gender, education, income • Q= relevant supply, e.g., forest land w/i 100 • C= climate variables (temp, aridity index, etc) • Yields per capita days equations (Daysik) • Simulation Step • Dayskt based on projected SDktQktCkt • Combine Dayskt & participating populationkt • Create index based on predicted totals • Scale NSRE baselines (2005-2009 avg.) by index 2010 RPA Assessment Roll-Out Briefing
Participation Model Influences • Consistent with existing outdoor rec literature • Black (neg) • Native American (pos) • Asian (neg) • Hispanic (neg) – except for Day Hiking • Educ (neg) – consumptive & motor activities • Educ (pos) – nonconsumptive & challenge • Income (pos) – most activities • Gender – boys still play more outside • Population density (neg) – crowding or urban effect? • Resource availability (positive) • Climate (generally negative)
Findings—across all scenarios and climate alts. • Participation declining on per-capita basis • Participants increasing (pop change > per-capita) • Days similar story • More total recreation days and participants • Highest growth rates for participant numbers : • Developed skiing (50 to 127 percent) • Equestrian activities (44 to 110 percent) • Challenge activities (47 to 90 percent)D • Day hiking (45 to 88 percent) • Swimming (47 to 85 percent). 2010 RPA Assessment Roll-Out Briefing
Findings—across all scenarios and climate alts. • Averaged over all RPA scenarios and climate alts. greatest total days increase over the next 50 years: • Nature viewing (13,597 to 14,635 million) • Swimming (2,298 to 2,446 million) • Day hiking (1,366 to 1,470 million) • Developed site use (1,185 to 1,294 million) • Birding (1,141 to 1,246 million). • Loss to least total days increase over next 50 years: • Snowmobiling (-27 to 16 million) • Hunting (-8 to 14 million) • Undeveloped skiing (-5 to 29 million) • Challenge activities (86 to 89 million) • Floating (83 to 128 million).
Forecasts---U.S. Natural Resources • Land development will continue to threaten the integrity of natural ecosystems. • Climate change will alter natural ecosystems and affect their ability to provide goods and services. • Competition for goods and services from natural ecosystems will increase. • Geographic variation in resource responses to drivers of change will require regional and local strategies to address resource management issues.
Forecasts---U.S. Natural Resources Urban and developed land use area increases across all scenarios. Forest and rangeland use area declines in all scenarios, as do cropland and pasture use areas. FYI---These forecasts are at county scale Land use change by RPA scenario 2010-2060, conterminous United States
Forecasts---U.S. Natural Resources Forests are most impacted by urban and developed uses, with up to 8% of the forest land base in the South lost by 2060. Change in nonfederal forest area, 2010-2060, conterminous United States
Public Land Threatened by Development Low density development threatens ecosystem integrity. Housing growth in and near NFS and NPS lands, 1940-2000.