Download
1 / 21
210 likes | 344 Views
Data to Knowledge to Results Review and Analysis of Paper by Davenport et al. Team: Something Different Myron Burr Kevin McComas Easwar Srinivasan Bill Winett. Data : Measures, Transactions. Knowledge / Information. Parts per hour Billing rate Click through rate.

E N D
Data to Knowledge to ResultsReview and Analysis of Paper by Davenport et al Team: Something Different Myron Burr Kevin McComas Easwar Srinivasan Bill Winett
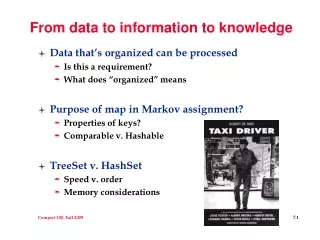
Data : Measures, Transactions Knowledge / Information Parts per hour Billing rate Click through rate Profit maximizing product mix Profit maximizing bundling of solutions Individualized, targeted web pages Data vs Information
What are the Issues? • Background: • Firms are spending billions on IT applications ( ERP, POS scanners, web and e-commerce systems, and CRM) • Generated billions of transaction records • Observation: • Very little data is converted to knowledge (less than 10% in studied firms) • Problem Statements: • Lost opportunities for improved results • Unrealized business value from these investments
Proposed Approach to Resolution • Davenport et al, researched over 100 companies • Developed a model for building analytic capability • Demonstrated how to realize results from this capability
Strategy • What are our core business processes? • What key decisions need analytic insights? • What information matters? • Clear strategy leads to good measurements and therefore good data gathering
Context • Process needs a foundation • Required ingredients for success • Grounded in • Firm’s strategy (and the information needed to execute this strategy) • Skills and experience of staff • Organization and culture • Data-oriented / Fact-based • Technology and Data
Skills and Experience • Key Roles • DB Administrator: loads, organizes and checks data • Business Analyst / Data Modeler • Decision Maker / Outcome Manager • Skills: Depth depends on above role • Technology Skills • Statistical Modeling and Analytic Skills • Knowledge of the Data • Knowledge of the Business • Communication and Partnering Withoutskilled staff, IT applications are a waste of $$$.
Organization and Culture • 62% of managers: organization and culture biggest barriers to getting significant return on IT investment • Related to skills and experience • Value Data-oriented / Fact-based analysis and decision making • Organization of analytics staff • Centralized or decentralized depends on: • Sophistication of the analysis • Amount of local knowledge needed • Cultural orientation of the firm
Technology and Data • Specific hardware and software, networking and infrastructure • Transaction versus analytic approach • Integration of analytic technologies • Requires human insight; can’t automate • 60 to 80% of cost in cleaning up and integrating data
TransformationData to Knowledge • Analytic and Decision Making Process • Depends on experience and relationships of analysts and decision makers • Working closely with decision makers to understand the questions: • Standard, highly-structured: Inventory? Sales? • Semi-structured: Optimum inventory level? Production versus forecasting? • Unstructured: customer segment migration? • An evolving and iterative process • Use “decision audits” to evaluate effectiveness of process
Outcomes • Desired financial outcomes (greater profitability, revenues, or market share) may require changes in: • Behaviors: e.g., cost control • Processes and Programs: e.g., development of new marketing initiative • Extensive communication may be required • Implementation of decisions will determine result.
Application Methodology • Flowchart
Implementation Options • Business needs to dictate extent of implementation and level of focus
Examples Source: http://www.cs.csi.cuny.edu/~imberman/DataMining/KDD%20beginnings.pdf
More Results • Earthgrains eliminated 20% of products, increased profits by 70% • Owens & Minor won $100M contract by showing customer how to save money • Wachovia Bank improved performance by modeling branch locations • Harrah’s Entertainment plans to use customer data to increase cross-selling • Fleet Bank saved >$12M encouraging customers to change from branches to ATMs
Other Applications of Data to Knowledge to Results Source: http://www.cs.csi.cuny.edu/~imberman/DataMining/KDD%20beginnings.pdf
Take-Aways To get the most from your IT investment: • Hardware, software, networking and infrastructure only the starting point • You need to commit significant skilled human resources • Develop sophisticated analytic processes • Instill culture that values data and creating information • Make decisions on info and then execute
Additional Resources • SAP.com • Oracle.com • Google Analytics • Accenture.com • Spotfire.com • i2.com • Salesforce.com • cio.com • b-eye-network.com • juiceanalytics.com • WonderWare.com