Download
1 / 13
130 likes | 230 Views
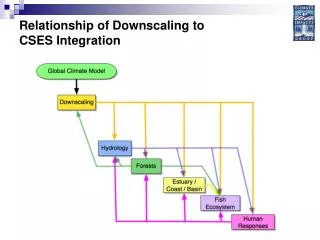
Temperature and salinity analysis over the Atlantic in real time - Qualification of measurements E. Autret, F. Gaillard. Analysis of temperature and salinity over the Atlantic. Method Objective analysis (Bretherton et al.,1975) Data

E N D
Temperature and salinity analysis over the Atlantic in real time-Qualification of measurements E. Autret, F. Gaillard
Analysis of temperature and salinity over the Atlantic Method • Objective analysis (Bretherton et al.,1975) Data • Temperature and salinity profiles collected and controlled in real time by CORIOLIS from Argo profilers, GTS or oceanographic vessels (XBT, XCTD, CTD). Analysis over the Atlantic (run in operational mode since December 2002) Analysis produced by the data center computes • T & S fields • On a grid with 1/3° resolution (PSY1-Mercator) • At 59 levels down to 2000 m • Analysis residuals for each observation
Use of residuals to qualify measurements • Residual: difference between observation and analysis at a measurement point • Instrument error (nominal accuracy + drift) • Sub-grid scales • Inconsistency between a priori statistics (climatology mean and variance) • Time and space structure of residuals: help discriminate between these different components (necessary before any attempt of producing a correction). • Statistical behavior of the residuals provide a mean for detecting sensor drifts or biases combining 3 methods usually applied separately: • Reference to a climatology • Colocation • History of the sensor
I. Real time • -> REAL TIME:Operational alert system on the S & T analysis run every Wednesday since June 2003 over the North Atlantic and daily since nowadays over the Atlantic. • Systematically generated HTML files: • Display of adimensional residuals for each profile. • List of profiles (plateform number, position, date, reference, …) pointed out (|Adim. Res. |>2)
II. Delayed mode Objective: diagnose the behavior of the whole fleet of floats by using the analysis residuals. Data set: 2002-2003 re analysis using 425 Argo floats (between December 2001 and January 2004) with measurements having «PSAL_QC» and «TEMP_QC» ‘1’ or ‘2’. Diagnostics are based on graphic tools: Example of diagram for a given float (for 4 layers) On the left: time series of the adimentional residuals for 3 layers On the right: T residuals versus S residuals
II. Delayed mode 425 floats Visualization of Tres-Sres plots (30 minutes) 61 floats pointed out Visualization of time series
II. Delayed mode 425 floats Visualization of Tres-Sres plots (30 minutes) 61 floats pointed out Visualization of time series
II. Delayed mode Bias
II. Delayed mode 425 floats Visualization of Tres-Sres plots (30 minutes) 61 floats pointed out Visualization of time series
II. Delayed mode Drift Float 6900163 – residual mean for 2 layers 1000-1600 and 1600-2000 m
II. Delayed mode 425 floats Visualization of Tres-Sres plots (30 minutes) 61 floats pointed out Visualization of time series
Conclusion Operational system: Real time . T & S fields over the Atlantic (global ocean by the end of 2004) . Quality control tool - Delayed mode: . Tool for the global control of the fleet, . Once outliers detected: .Offsets constant over depth can be estimated within 0.01 psu, . In case of drifts (time varying) we must decide whether it is due to the analysis (inconsistency with climatology) or to sensor drift. Each case should be looked at individually and compared with other methods.


![Synthesis of [2]- and [3]- ferrocenophanes containing trivalent phosphorus centers](https://cdn3.slideserve.com/5684555/synthesis-of-2-and-3-ferrocenophanes-containing-trivalent-phosphorus-centers-dt.jpg)