Download
1 / 45
690 likes | 1.54k Views
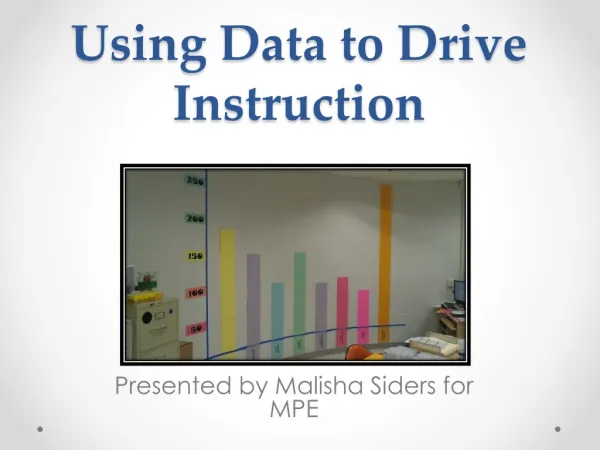
Using Data to Drive Instruction. Presented by Brooke Beavers and Jackie Gantzer. Overview. Why data driven instruction? Using data in our schools Different ways to look at data Effective systems Supports. Why Data Driven Instruction?. Provides our schools with accountability

E N D
Using Data to Drive Instruction Presented by Brooke Beavers and Jackie Gantzer
Overview • Why data driven instruction? • Using data in our schools • Different ways to look at data • Effective systems • Supports
Why Data Driven Instruction? Provides our schools with accountability Offers feedback for teachers and administrators Presents resources to better communicate with students and families Assists teachers in targeting instruction Provides the school community opportunities to identify effective instructional strategies Drives Professional Development to meet the needs of each individual staff Allows staff to celebrate and capitalize on strengths and progress
Using data in our schools School-Wide Grade-Wide/ Content Area Class- Wide
School-Wide • Identify areas where entire staff can improve • Develop School Improvement Plans • Create School-Wide Goals and Timelines to meet these Goals
School-Wide Example • Tindley Math Curriculum • 2011 ISTEP+ Data • 6th-8th Grade Averages: • ISTEP+ Pass Rate: 83% • ISTEP+ Pass+ Rate: 10% • Driving Question/Focus: How can we improve instruction to continue expanding our pass rate, while pushing more students towards the pass+ level? • ISTEP+ Applied Skills Average: 44% (lowest of all areas)
Problem Solving: Mathematics The Tindley Math Department included a writing portion as part of the Math Problem Solving Ladders this year Incorporating Critical Thinking was a data-based decision; students were struggling with communicating the steps they took to solve multi-step problems. All Grade levels made tremendous growth in mathematics on this year’s I-STEP.
The Numbers Don’t Lie… • Tindley Math Curriculum • 2012 ISTEP+ Data • 6th-8th Grade Averages: • ISTEP+ Pass Rate: 92% (+9%) • ISTEP+ Pass+ Rate: 27% (+17%)
Grade-Wide • Utilize grade-level/content area meetings to analyze data • Identify trends/strengths/weaknesses • Devise a plan • Develop and share resources • Put the plan into action
Grade-Wide Example 6th Grade
6th Grade Data Driven intervention plan 6th grade teachers at Tindley used Interim data to drive 7th period remediation groups. Once a scholar was able to demonstrate mastery of specified skill deficits, he/she had the opportunity to “exit” out of 7th period. Remediating as a grade level paid off. Skill levels increased and high-stakes tests produced effective gains.
6th Grade Data Driven Intervention Continued… 6th grade teachers worked together to determine who would remediate specific subject areas based on success/expertise. Scholars were sorted into re-teach groups based on areas of need.
Grade-WidePlanning:Strategies to Incorporate When deciding on strategies to utilize, the 6th grade team collaborated together…
“The proof is in the pudding…” This year was the most successful 6th grade I-STEP pass year for Tindley to date…
Despite compelling evidence indicating that working collaboratively represents best practice; teachers in many schools continue to work in isolation. “ - Educational Leadership, 2004 Some things to consider… What can building leaders do to promote teacher collaboration? How do leaders promote the shift of just looking at averages to analyze student performance and begin to focus on the success of each individual student? When can this type of collaboration occur? Consider school-wide systems that could be established to maximize time and effectiveness.
Class-Wide • Puts critical information into the hands of the individual teacher • Teachers examine and sort data • Teachers develop intervention plans based on skill deficits/areas of growth/enrichment • Strategic, targeted instruction occurs to improve student learning
Class-Wide Example Duke Cohort, 6th grade boys
Looking at the big picture… Math Interim 2
Looking at the big picture… Reading Interim 2
Using Data to Plan The teacher looked at her student’s overall scores and identified who was not proficient. She then broke down the standards/skills scholars struggled with.
Planning Class-Wide Scholars were grouped based on proficiencies/deficits.
Planning Class-Wide:Strategies to Incorporate When deciding on strategies to utilize, the teacher thought about which approach would work best for her individual student’s needs and engagement.
Planning Class-wideTailor Instruction Additional Instruction The teacher developed a plan and remediation schedule for all “non-proficient” scholars. She shared this plan and its importance with parents via letter and personal phone calls.
Planning Class-WideTailor Instruction Intensive Instruction • Some students were going to need intensive instruction. • Things to consider • Effectiveness • Time Efficiency • Difficult Conversations
The numbers don’t lie… • Percent Pass Math Percent Pass ELA Interim results increased dramatically once targeted interventions based on data were put into place for the Duke cohort.
Observation feedback + data Identify key indicators of success in the classroom Accurately point out instructional deficits in the classroom Create groups of students with similar learning targets and differentiate Determine instructional interventions/enrichment Identify skills that need to be re-taught/reemphasized Examine/refine ladders to get the most “bang for your buck!”
6 Steps for Giving Effective Feedback • In partners, use the data provided to practice using the 6 steps for giving effective feedback. • Praise • Probe • Identify the problem and action step • Practice • Plan ahead • Set time for follow-up
Celebrate Replicate Capitalize • CELEBRATE: successes, growth, progress • It’s good for morale, good for the soul • REPLICATE: methods used to reach success • If it worked once, it can work again • CAPITALIZE: the strengths in the building • People are hesitant to “brag.” We need to exploit them and their talents
School-Wide Example What did we do well? Growth in math scores across the board How did we do it? Incorporation of writing and more advanced problem-solving expectations How can we replicate and capitalize? Incorporation of reader-response journals and more intensive writing expectations across the board
Grade Level/Content Area Example How did we do it? Both groups had embraced the data-drive, 7th period targeted instruction model. They “shared” scholars to work towards building skills for the whole grade. What did we do well? By Interim 3, students in 6th and 8th grade were performing in the upper 70s in both Math and Reading. How did/can we replicate and capitalize? The 7th grade (who was performing in the upper 60s by Interim 3) incorporated the 7th period model of skill reinforcement/remediation. While we didn’t have another Interim to compare results to, it is easy to contribute the strong ISTEP+ performance to this instruction. Next year, this model and system will be in place immediately, so that all teachers and scholars can capitalize on its success.
Teacher/Classroom Example What did she do well? One 9th grade teacher improved scholars’ essay scores from a 64% to a 78%. How did she do it? Incorporating Reader’s Response Journaling into class, holding high expectations for scholars ideas and conventions How can we replicate and capitalize? Next year, all Humanities and English classrooms will incorporate Reader’s Response Journaling every week to promote the same kind of critical thinking and exemplary writing we expect by the end of the year.
Application – Data Driven Decisions by School Leaders • Sample Data • Initial Reactions • Clarifying Questions • Next Steps
Application - ACUITY Predictive Test #1 Given in late-September School-Wide Results (6-8) ACUITY Pass ≈ 65% 78.9% 74.5% 77.8%
Application – School-Wide ACUITY Results 1) Initial Reactions? 2) Clarifying Questions? 3) Next Steps?
Application - ACUITY Predictive Test #1 Given in late-September Grade Level Results 84% ACUITY Pass ≈ 65% 73.6% 66% 80.2% 72.2% 56.6%
Application – Grade Level ACUITY Results 1) Initial Reactions? 2) Clarifying Questions? 3) Next Steps?
Application – Class-Level Results: 6th Grade 86% 79% 74% 67% 62% 75% 68% 63% 45% 32%
Application – Grade Level ACUITY Results 1) Initial Reactions? 2) Clarifying Questions? 3) Next Steps?
Data Analysis Reflection Forms • Teachers fill out after each assessment. They determine: • Class Average • Skills of concern • Plan to address skills • Students of concern • Plan to address students
Data Analysis Reflection Forms Teacher 6B 1) Initial Reactions? 2) Clarifying Questions? 3) Next Steps?
Data Analysis Reflection Forms Teacher 6E 1) Initial Reactions? 2) Clarifying Questions? 3) Next Steps?
Guide your teachers to Resources… Peers ACUITY IDOE Website Learning Connection Brain Pop! Reading A-Z Atlas SMART Exchange You Tube/Teacher Tube betterlesson.org Celebrations and Observations
In Conclusion… Collecting and analyzing data is ESSENTIAL to our efforts of continuously increasing our effectiveness. Without it, we don’t know where we’re going or why we’re doing what we’re doing.
Reflection What are you looking forward to in regards to using data at your school? What are some areas of concern you have about using data?