Download
1 / 40
410 likes | 567 Views
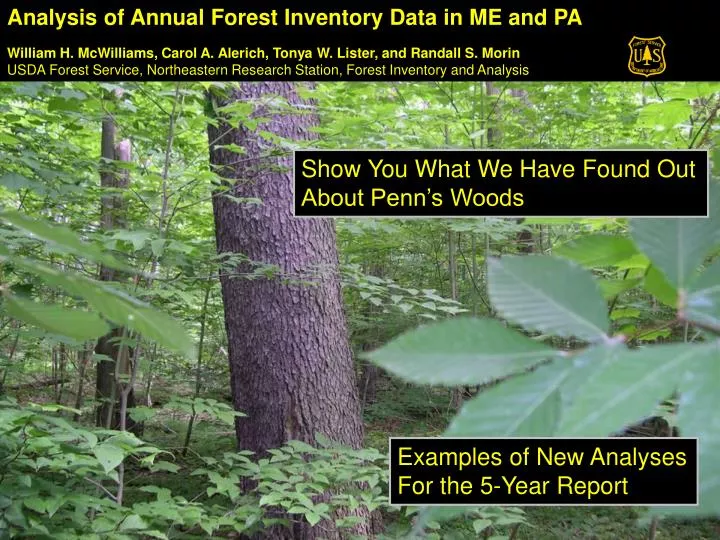
Analysis of Annual Forest Inventory Data in ME and PA William H. McWilliams, Carol A. Alerich, Tonya W. Lister, and Randall S. Morin USDA Forest Service, Northeastern Research Station, Forest Inventory and Analysis. Show You What We Have Found Out About Penn’s Woods. Examples of New Analyses

E N D
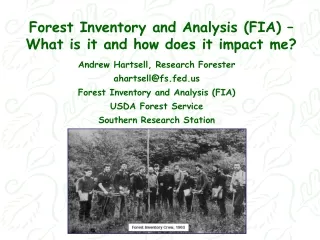
Analysis of Annual Forest Inventory Data in ME and PA William H. McWilliams, Carol A. Alerich, Tonya W. Lister, and Randall S. Morin USDA Forest Service, Northeastern Research Station, Forest Inventory and Analysis Show You What We Have Found Out About Penn’s Woods Examples of New Analyses For the 5-Year Report
Regeneration Study: 2001 Exotics Survey: New in 2003 Associated Vegetation Tree Seedlings Progress Update - Inventory
Annual Reporting, 2001 and 2002 Annual Reporting, 2003/4 Progress Update - Reporting • Five-Year Reporting: • Penn State Issues Conference, April 26-27, 2005 • Comprehensive Report
Mega-Trends: Land-Use Change Forest Land Base is Stable
Mega-Trends: Land-Use Change Urbanization Population Density Nonforest 0 1-25 25-50 Parcelization Fragmentation 50-100 Forest 100-250 250-500 500-1000 >1000 Urban area
Mega-Trends: Structure Distribution of Forest Land by Stand-size Class 59% 49% 49% 28% 23% 11%
Mega-Trends: Structure Number of Growing-Stock Trees Per Acre
Mega-Trends: Composition Oak is Decreasing and Red Maple is Increasing
Current Threats Ailanthus vs. Oak + 19% + 57% + 77% + 15% Inventory is Increasing at a Slower Rate than in the Past Alien Pests are Here and More are on the Way Advance Regeneration is Lacking and Options Are Expensive Invasive Plants are Here and Expanding Their Influence Effects of Urbanization, Parcelization, and Fragmentation Reduce Management Options Composition and Structure are Changing
Management and Policy Implications Financially Mature, High-Value Stands Predominate PA’s forested landscape “Timber Availability” is less than FIA Data Imply Timber Industry Will Need to Adapt to Species Like Red Maple Recreation Value is Approximately Equal to Timber Value in Many Areas Methods to Project Current Conditions into the Future Need to be Developed Better Wildlife Habitat Models Would Help Gauge Prospective Trends Stand Rehabilitation will be Needed in Disturbed stands with Poor Regeneration Sustainable Forestry on Private Lands Needs Assessed Prepare Management Strategies for Late Successional and Old Growth Stands Strategies for Invasive Plants and Pests Need Further Development
Castanea dentataMap Regional Study Examples
What, Where, and When of the Next Spruce/Fir Forest? Frequency of Spruce Budworm Defoliation
Next 20 Years of Ingrowth 4-inch Class 3-inch Class 5 Years 10 Years Low 2-inch Class 1 inch Class High 15 Years 20 Years Principal Findings: The Next Generation of Spruce/Fir Forest (Where and When?) Current Distribution of Saplings
Red Spruce Balsam Fir Eastern White Pine % BA/AC Paper Birch Beech Northern Red Oak Principal Findings: Inventory (Where?) Where are the Major Species Concentrated?
What We Can’t Tell You Now Less Than 50% of Plots Were Remeasured Old Design New Design Only Central Portion Remeasured! Only About 10% of Trees Remeasured the First Time Through Growth, Removals, and Mortality Are Not Statistically Sound, Yet We Will Remeasure More Trees This Season Than We Did in the First Five Years!
Carbon Stocks and Accumulation Tree Carbon Per Hectare by U.S. County 1015 grams by eco-component National Reporting Examples
Distribution of Mixed-Oak Stands in the Eastern US Mixed-Oak Stands by Stand-Size Class Quercus spp. Map
Population Density Nonforest 0 1-25 25-50 50-100 Forest 100-250 250-500 500-1000 >1000 Urban area Urbanization
Parcelization – Private Forestland (Source National Woodland Owner Survey, 1994)
Forest Interior Migrants Generalists Specific Threatened Habitat Concerns?
Late-Successional and Old Growth Forests Mixed Oak 0 100 200 300 Age / Size (After Whitman and Hagen, 2004) Quantify Extent and Character Spatial Distribution For Major Forest Community Types (follow Fike and Jenkins)