Download
1 / 51
510 likes | 512 Views
Leveraging the environmental markets. IEA Bioenergy Task 38 Conference Ö stersund, Sweden, 30 September 2003 Christiaan Vrolijk Natsource Tullett Europe Ltd. About Natsource. Trading floors globally North America, Europe, Asia-Pacific Transactional services Electricity, natural gas, coal

E N D
Leveraging the environmental markets IEA Bioenergy Task 38 Conference Östersund, Sweden, 30 September 2003 Christiaan Vrolijk Natsource Tullett Europe Ltd
About Natsource • Trading floors globally • North America, Europe, Asia-Pacific • Transactional services • Electricity, natural gas, coal • Greenhouse gases, renewables, SO2, NOx, weather • Financial services • Value & asset management • Buyers Pool • Strategic consulting • Multinationals, EC, NL, UK, World Bank, etc. • Dedicated to marking environmental markets work
Natsource’s credits • Largest green markets broker • Voted best broker many times • 1st UK trade • Over 50% of the UK market • 1st Danish trade • 1st international swap of compliance tools • 1st trans-atlantic trade • 1st trans-pacific trade
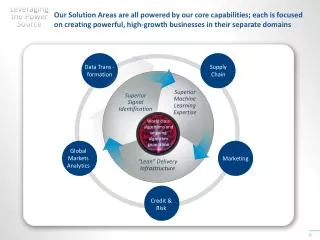
This presentation • Generating value for renewables • The renewable certificate markets • The greenhouse gas markets • Conclusions
What value ? • Power • Renewables component • Avoided GHG • Security of supply • Embedded benefits • Local benefits
Power • Liberalisation of electricity markets for several reasons • Including more competitive power prices • Small and intermittent power can only get discounted price • Thus bad news for renewable generators?
Small benefits • However, benefits exist for renewables • Security of supply by diversifying sources • Embedded benefits • Market opening • Auto-generation • Market access for all
Renewables component • Some countries have special renewables support systems • Feed-in tariffs • Certificates • Tax advantages • Voluntary demand (green power)
Kyoto Protocol • Greenhouse gas emission reductions targets • Targets for industrialised countries • 5% reductions from 1990 level • ‘Flexible mechanisms’
Greenhouse gases Denmark UK (C)ERUPT Other governments PCF VERs EU allowances Kyoto mechanisms Renewables Netherlands UK Sweden Italy Belgium Austria RECS EU Directive US & Australia Jo’burg (WSSD) Energy security Environmental markets
Buyers Hedge risk Proprietary trading Green public image Policy development Diversify portfolio Green Power Sellers Monetise asset Finance projects & technology Brand Recognition Policy development Capture revenue in case of Kyoto failure Drivers for early trading Environmental markets = Risks & opportunities
UK ROCs • Started: April 2002 • Annual obligation increases: • 3% in 2003 • 10.4% by 2010 (indicative 18% in Scotland) • & 20% by 2020 (?) • Strong demand, shortage of supply • Short in the first 3–4 years • Trend: short until at least 2010 • Existing installations mostly under NFFO • No Imports, limited banking
UK ROCs • Trades • Few publicised trades, no details public • Most trades between existing partners • Natsource has brokered several trades with various structures • Price • £42 – £48 (stand-alone) • NFPA auction ~£64 (bundle) • £30 buy-out, recycling, levy exemption, embedded benefits • Most plants tied in with NFFO
Difficulties in the ROC market • Value of recycle • TXU & BE • Other price risk • Political risk • changes to LECs, criteria, technologies • Contracts: • No standards, length, volume, credit risk
Dutch green certificates • Green tariff based on tax exemption • Voluntary, no target (yet) • Started in July 2001 • Many trades in 2002 • Prices varied depending on techno/location • Problem: too much imported from existing plants • Substantial changes announced this month • Tax exemption was €60/MWh, now €30 • Will be €15 and €0 in 2005
Belgium: • Carbon weighted certificates • Walloon scheme include cogeneration • Certificates from other Belgium regions are not accepted • Penalty €75 & going up • Minimum guaranteed prices by technology • Off-shore wind, €90 • On-shore wind , €50 • Hydro , €50 • Sun , €150 • Other (including biomass) , €20 • Network operator will auction these certificates
Other markets • Italy: • Obligation on generators and importers, 2% of previous year’s fossil fuel power • Reciprocal imports • Post-1999 power only • Does not include CO2 value
Other markets • Sweden: • Start in 2003 • Starting at 6% in 2003 increasing to 15% in 2010 • Prices Skr 200 – Skr 220 • Austria: • Small hydro certificates • Different obligations for the Länder
Other markets • US: • California • New Jersey • Pennsylvania • Massachusetts • Texas • Australia • Finished and over taken by green power • Worldwide
RECS • Renewable Energy Certificate System • European-wide initiative • Voluntary • Infrastructure is used by markets • Trades have taken place • Slow market • Low prices (€1 – €10 per MWh)
Historic demand • First transactions from 1997 (Kyoto) • ERs Emission Reductions • VERs Verified Emission Reductions • Early transactions • Some 100 MtCO2e • Voluntary commitments & forward contracts • Prices low: $1 – $2 / tCO2e
Current buyers • World Bank Prototype Carbon Fund • Dutch government Erupt & Cerupt • Private funds • Other governments: • Austria, Sweden, Finland, US States, etc. • Private companies • Voluntary • Compliance regimes (UK, Dk, EU)
Danish compliance market • Electricity sector CO2 emissions only • Started with 8 participants, now only 4 • Thus confidential prices • No CDM in the Danish market • But buy-out penalty/cap at ~€4 • Thus low market prices • In operation from 2001 to 2003 • Folding into EU ETS
UK ETS – Some Facts • Over 300 trades have occurred to date • Majority 2002 spot trades • Many forward trades for ’03 • Few forward trades for ‘04 • Total volume traded: • About 1,500,000 allowances • Prices today at ~ £3.00 per allowance • Highest trade ~ £12.40 end-Sept
UK ETS – Some Facts • Who has been trading • Direct Participants • Trading Companies • CCA Participants • Individuals • Majority of early trades (April – June) involved direct participants and traders • CCA Participants more active from July onwards • Direct participants have provided the major source of supply in the market • CCA participants have been the major buyers • ~40% of all allowances traded
EU ETS • Gases • CO2-only 1st phase (2005–2007) • All gasses may enter 2nd phase (2008–2012) • Allocations • At least 95% free 1st phase • Allocation plans still to be decided • Penalties • €40 /tCO2e 1st phase • €100 /tCO2e 2nd phase • Limited banking and borrowing • Reporting
EU ETS • Trading in allowances in the EU • Sectors (energy, metals, cement, minerals, paper & pulp, opt-out) • Gases (CO2-only first) • Allocations (free, but plans to be decided) • Penalties, banking, borrowing, reporting • Trading TODAY • Uncertainty remains (who’s long, who’s short?)
EU ETS projects • Limited scope for CDM and JI • Kyoto credits allowed to be converted into EU Allowances • Not LULUCF • Not Nuclear • Large hydro under conditions • 6% trigger for review to cap • 8% cap? • EU private sector demand for CDM/JI credits
Kyoto Protocol • Great uncertainties • Prices? • Emissions trading • Joint implementation (JI) • Clean development mechanisms (CDM) • LULUCF
Institutional buyers • World Bank’s Prototype Carbon Fund • Payment on delivery • Wide host country & technology portfolio • Purchase price range: $2.5 – $4 /tCO2e • Portfolio outcome: ~ $5.6 / tCO2e • Netherlands (Erupt and Cerupt) • Take on risks, early market entry (thus pay less) • Payment on delivery • Early prices: €5 – €9 /tCO2e • Current price range: €3 – €5 /tCO2e • Other World Bank funds
Recent developments • Changes in demand structure • National trading schemes • Marrakesh Accords & 117 Parties • Emission constraints become reality • Affected companies begin looking for Compliance Tools
Ratification status Ratified (118 total) Ratified & DNA (19) Not yet ratified Rejected / non Parties to FCCC 25 Sep 03
Price v. risk • Guaranteed Kyoto Compliance Tools • Sellers risk: project, volume and price risk, Kyoto eligibility and credit worthiness • Buyers risk: credit and price • Buyer will discount for risk & time • Seller might have to contract emergency replacement reductions on the market
Quest for Compliance Tools Japan Units EU Units US Units Kyoto Compliant Units CDM Units JI candidate Unit CDM candidate Unit JI Units Canada Units UK Units
The Climate Investment Partnership • The CIP evolved from Vienna Group which Natsource was leading • Original Vienna Group members • Swiss Re • EBRD • Austria Wirtschaftsservice • Finfund • Etc.
Other investment initiatives • Natsource is working with others to channel investment into renewables (and emission reductions) • Using Natsource’s experience in negotiating Purchasing Agreements for bundles of power and environmental aspects • Buyers pool
Lessons from the market • CDM/JI projects deliver credits for 2008 – 2012 period • Creditworthiness is key • Financial crisis / Enron scandal • Financing/insuring • Added project risks? • ‘Additionality’ • Inherent project difficulties • Very hard to generate additional value for renewables projects
Getting Ready • Risk management team • Environmental and Finance Dept interacting • Preferred hedging tools/appetite for risk • Construct and verify CO2/GHG emission baselines • Develop target scenarios for EU scheme or Kyoto period • Market acceptance/timing of structure → Speak to Natsource & other providers
Conclusion • Market developments will be influenced by: • The pace of Ratification of the Kyoto Protocol • The pace of Harmonisation of domestic programmes • The Launch schedule of the EU trading scheme • Actions and attitudes in the US, Canada, Japan and Russia • Real world market examples to build Confidence • Markets will benefit from: • Clear policy • Harmonisation
Contact / information Transactional & advisory services: Tel: +44 –20–7827–2942 cvrolijk@natsource.com www.natsource.com Calgary – Houston – London – New York – Oslo Ottawa – Tokyo – Toronto – Washington DC