Download
1 / 31
310 likes | 404 Views
The set of input values of a relation or function. domain. two sets of data that have a correlation where both sets of data values increase. Positive correlation. A graph made up of unconnected points. Discrete graph. Two data sets that have no relationship between the sets of values.

E N D
two sets of data that have a correlation where both sets of data values increase Positive correlation
A graph made up of unconnected points Discrete graph
Two data sets that have no relationship between the sets of values No correlation
A line on a scatter plot that helps show the correlation between data sets more clearly Trend line
A variable whose value depends on the value of the input, also known as the output of the function Dependent variable
One set of values decreases as the other set increases Negative correlation
A measure of the strength and direction of the relationship between two variables or data sets correlation
A variable whose value determines the value of the output, also known as the input of a function Independent variable
A graph made up of connected lines or curves Continuous graph
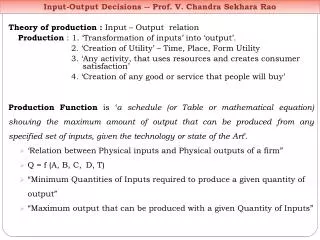
An algebraic expression that defines a function Function rule
A graph with points plotted to show a possible relationship between two sets of data Scatter plot
In an arithmetic sequence, the nonzero constant difference of any term and the previous term Common difference
If x is the independent variable and y is the dependent variable, then y = f(x),where f names the function Function notation
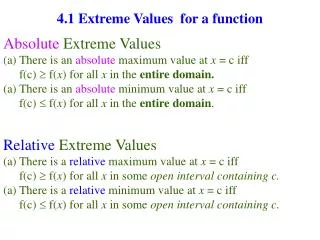
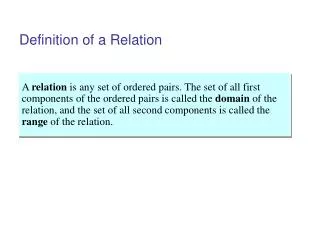
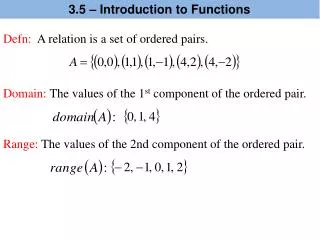
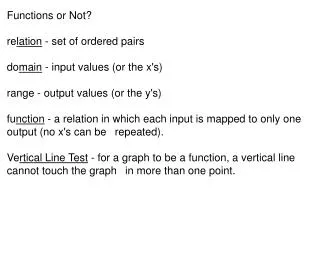
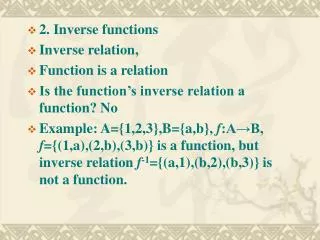
A set of ordered pairs relation
A sequence whose successive terms differ by the same nonzero number or common difference Arithmetic sequence
A type of relation that pairs each element in the domain with exactly one element in the range Function
A plane that is divided into four regions by a horizontal line called the x-axis and a vertical line called the y-axis Coordinate plane
The two perpendicular number lines, also known as the x-axis and y-axis, used to define the location of a point in a coordinate plane Axes
The intersection of the x- and y-axes in a coordinate plane origin
A pair of numbers that can be used to locate a point on a coordinate plane Ordered pair
The first number in an ordered pair, which indicates the horizontal distance of a point from the origin on the coordinate plane x-coordinate
The second number in an ordered pair, which indicates the vertical distance of a point from the origin on the coordinate plane y-coordinate
One of the four regions into which the x- and y-axis divide the coordinate plane quadrant
A value that substituted for the independent variable in a relation or function input
The result of substituting a value for a variable in a function output