Download
1 / 19
190 likes | 213 Views
Evapotranspiration Partitioning in Land Surface Models. By: Ben Livneh. Overview. Work in progress… Came about during recent work on merging models. Questions: What is evapotranspiration? Why is it important? How is evapotranspiration modeled? What are the most common assumptions?

E N D
Evapotranspiration Partitioning in Land Surface Models By: Ben Livneh
Overview • Work in progress… • Came about during recent work on merging models. Questions: • What is evapotranspiration? Why is it important? • How is evapotranspiration modeled? What are the most common assumptions? • How is evapotranspiration relevant to my research objectives? • Comparison of model estimates of evapotranspiration • Scope of present study and direction of future work.
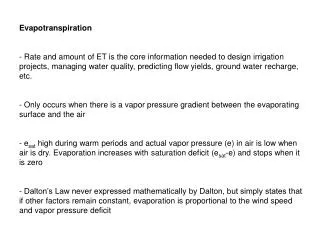
Evapotranspiration (ET) • Evapotranspiration (ET) is a term used to describe movement of water from the land surface to the atmosphere, and is the sum of evaporation and plant transpiration. • Responsible for energy and moisture exchange: determines how much precipitation is available for runoff and soil moisture, and how much re-enters the atmosphere. • ET influences the dynamic equilibrium of the surface water balance; important both for hydrologic forecasting and numerical weather and climate prediction
Partitioning ET into its components • ET can be partitioned into three major sources over land surface (excluding snow): 1. Canopy Evaporation → water intercepted by vegetation 2. Soil (sub-canopy) Evaporation → throughfall; 3. Plant Transpiration → movement of water within a plant, emerges from stomata and the subsequent loss of water as vapor through stomata in its leaves T ↑Ecanopy ↑Esoil ↑T
ET Partitioning What fraction of ET comes from the various components? • Difficult question, highly dependent on local conditions; observations are sparse. • Simulation of ET components using biophysical process-based models suggest global annual averages of: “Transpiration: 52%, Soil Evaporation: 28%, Canopy Evaporation: 20%”1,2 More recently, as part of the multimodel Global Soil Wetness Project 2: “Transpiration: 48%, Soil Evaporation: 36%, Canopy Evaporation: 16”3 • Choudhury and DiGirolamo (1998); • Choudhury et al (1998); • Dirmeyer et al, 2005
How is ET modeled? • Common in hydrologic models to use the concept of Potential Evapotranspiration: • Potential Evapotranspiration (PET) is a representation of the environmental demand for ET. It is a reflection of the energy available to evaporate water, and of the wind available to transport the water vapor from the ground into the lower atmosphere. Evapotranspiration is said to equal potential evapotranspiration when there is ample water (i.e. energy limited versus water limited).
ET Modeling Considerations • In hydrology models, the amount of actual ET for each component is frequently computed as somefraction (< 1) of PET, based on, for example: saturation of the free surface, radiation, wind; other factors: stomatal resistance, soil moisture stress, temperature, etc.. • Evaporation efficiency: the ratio of ET: PET • This ratio and the amount of PET is different in different models Noah Land Surface Model Example: Feather River Basin, CA Sacramento Soil Moisture Accounting Model PET E-Soil E-Snow E-Canopy Transpiration Noah SAC
ET Modeling: Partitioning Assumptions • Not all models provide the framework for the same partitioning of ET components: Example over continental U.S.: Soil evaporation dependent on: non-vegetated area (VIC model), greenness fraction (Noah LSM). VIC model: fixed veg. cover database Noah LSM: monthly greenness maps (satellite) Percent of land area available for bare-soil evaporation
Relevance of ET partitioning to my work Merging SAC model (hydrology model – no vegetation) with the Noah LSM (coupled with atmospheric models – mediocre hydrologic performace). How much total ET is realistic? What breakdown of ET components will give plausible results? SAC model Noah LSM
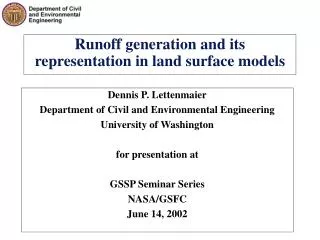
Experiment 1. Model intercomparison of ET components. • Run several well-known models (VIC model, Noah LSM, Community Land Model ‘CLM)’ over a 16 year period (1980 – 1996). • Compare seasonal ET components 2. Using observations of ET components, establish realistic ET partitioning within the model.
Average monthly total ET (mm) during summer: 1980 – 1995 (JJA) Noah CLM VIC SAC
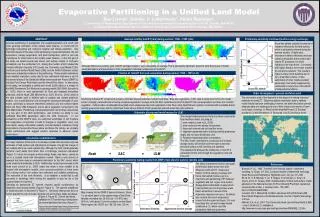
Average monthly soil evaporation during summer: 1980 – 1995 (JJA) Noah CLM VIC Fraction of total ET
Average monthly canopy evaporation during summer: 1980 – 1995 (JJA) Noah CLM VIC Fraction of total ET
Average monthly transpiration during summer: 1980 – 1995 (JJA) CLM Noah VIC Fraction of total ET
Comments • Although total ET between models is comparable, partitioning into individual components is drastically different. • Major differences in ET components due mostly to model assumptions. • True ET partitioning needed to validate model (observations?)
ET Observations • High quality, simultaneous observations of canopy, subcanopy, transpiration extremely rare. Techniques include: Transpiration: scaling observed sap-flow, or using chambers Soil and canopy evaporation: eddy correlation • Each technique has limitations and assumptions. Water balance closure an issue
ET Observations Okarito Forest, Westland, NZ: (43.2° S, 170.3° E, 50 m above sea level). Mixed conifer-broadleaf forest: Near Corrigin, Western Australia: (32 19S, 117 52E). Eucalypt woodland. Walnut Gulch, Arizona USA (31 43'N 110 W): Arid Shrubland. Harvard Forest, Maine, USA: (45°12' N, 68°8' W): Deciduous forest. Tonzi Ranch, California, USA (38.43 N; -120.96 W): Savannah • Data obtained from several international sites, thanks to gracious field investigators. Not all data is complete or contains all necessary fields to partition ET:
Work in progress • Remaining tasks: • Organize data to make model simulations • Compare specific ET components • Propose suitable ET mechanisms to achieve match with observations in emerging unified land model.