Download
1 / 41
410 likes | 545 Views
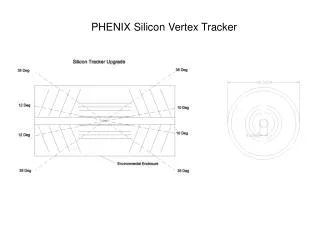
PHENIX Colaboration meeting 2012 @ Rikkyo University. Optical Alignment System for the PHENIX Muon Tracker . Rikkyo University Murata.lab / RIKEN Master course 2nd Kentaro Watanbe. Alignment for MuTr W physics. W signal : 500μm 〜 1.0mm MuTr Chamber resolution : 100μm.

E N D
PHENIXColaboration meeting 2012 @Rikkyo University Optical Alignment System for the PHENIX Muon Tracker Rikkyo UniversityMurata.lab/ RIKEN Master course 2nd KentaroWatanbe
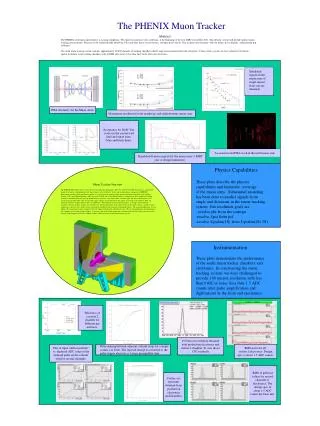
Alignment forMuTr W physics W signal : 500μm 〜1.0mm MuTr Chamber resolution : 100μm During the experiment period Each chamber moves 50 to 300 μm by the magnetic field or temperature excursion!!! the muon is flyting 15 degrees In order to achieve better momentum resolution We should correct for these relative movement!! The purpose of the optical alignment system(OASYS) is the real-time monitoring of the relative alignment among the stations.
Optical Alignment System ① The OASYS consists of a light source at station 1, a convex lens at station 2, and a CCD camera at station3. When an individual station moves, the image on the CCD camera moves reflecting the station movement. By observing the position of the light spot on the image of the CCD camera, we can monitor each station’s relativemovement. station1 station2 station3 OASys CCD → We use a halogen lamp and optical fiber as a light source for the OASYS. Optical fibers guide light from the halogen lamp It is attached on the edge of station1. Seven CCD cameras have been set up to each octant as in a diagram.
Optical Alignment System② OASys determines the center position by Fitting. First, it makes two histograms which are projected image on the horizontal or vertical axis.…. capture raw data image 6.6mm 8.8mm 56 OASYS cameras by each arm. total 112 cameras Resolution for the CCD camera The typical brodimage The typical sharp image The results of measurement are peak position distributions for 1000 samples obtained within 30 minutes. The typical sharp imageand the typical broad image are displayed. The measured resolution is 1.4 μm for sharp image, and 3.1 μm for the broad image. resolution is 3.1 μm resolution is 1.4 μm
Optical Alignment System All camera X direction North Arm 12 camera broken Normalize vertical (first day opsition) Range : -15[pixel] to 15[pixel], Horaizontal Range : 2010/1/10~2010/4/20 All camera X direction South Arm 3 camera broken
Movement of optics Daily fluctuation Y direction Run9 first of March to end of June This fluctuation is defined error of long term. X direction 10μm one day Fourier transform No Peak Spectrum ! 4 month I’m focused the movementof the long term. So, I treat daily fluctuation as random noise. it means the error bar of OASys become about 10μm
Linear Fit the Movement of optics X direction Y direction 70μm 90μm I think this long term movement as the rotation or translational motion or Monotonic expansion of the chamber by the fixture degradation, land subsidence.
Linear fit all camera: North Arm X direction 2009 3/1 〜 6/30 (120day)
Linear fit : North Arm Y direction 2009 3/1 〜 6/30 (120day)
Linear fit : South Arm X direction 2009 3/1 〜 6/30 (120day)
Linear fit : South Arm Y direction 2009 3/1 〜 6/30 (120day)
OASys Vector Map in Run9 South Arm North Arm What do you think this movement ?? It is real chamber movement ??
Zero Field Run Saggita Analysis We mustconfirm that OASysparameter can be tracing real chamber movement by another independent tool. It is “zero field run saggita analysis !!” Because, in the zero magnetic field, almost track became straight. It meansthe sagitta will disturibute around 0.0 external point external point stub point st2 stub point st1 How to define the sagitta sagitta stub point st3 stub point st3 collision stub point st3 external point sagitta = ー ※The external division is defined from 2 stub information (st1&st2).
Sagittadistribution & miss Alignment January March May zero field cosmic 1st zero field 2nd zero field pp200GeV pp500GeV 2009 PHYSICS RUN chamber moving ?? mean May mean March Miss Alignment = mean_March – mean_May > chamber resolution
Muon momentum study pp500GeV This spectrum is pp500GeV track associated muonmomentum distribution (No track cut ). under 10GeV 97.3% of ALL !! 500GeV (3104228/3187765) 97.3% momentum [GeV] run condition
Muon momentum study pp200GeV 200GeV (961325/945105) 98.3% under 10GeV 98.3% of ALL !! High pt spectrum seems to decrease than pp500GeV. However under 10GeV muon is 98.3%, high ptmuon is not sensitive for the residual distribution. momentum [GeV] run condition
Muon momentum studysummary 1/p Normalized (〜10GeV) Normalized log scale pp200GeV pp500GeV pp200GeV pp500GeV 0.2GeV 1GeV 1/momentum [/GeV] momentum [GeV] The residual distribution is based on under 10 GeVmuon. The spectrum is same in pp200GeV and pp500GeV. It means the residual from different beam can be compered. And the different of beam is not sensitive 2nd gaussian.
simulation study From zero field cosmic study, we make sure second gaussian component is not based on hadron decay. So, we guess that component will be based on the effect of multiple scattering another momentum. After the last meeting, Oide-san gave me simple multiple scattering root macro. I modified that macro to near real condition. Fist Step : Air volume contribution (fix muon momentum) st3 st1 2GeV muon At first I assumed if 2.0 GeVmuon go through between St1 to St3. Then muon is affected by the effect of multiple scattering from air volume. I want to know the final position (St3) is how much spread by that effect.
calculation by hand The multiple scattering is roughly Gaussian for small deflection angles, the projected angular distribution, with a width given by The projected y direction distributionis given by @ South station2〜station3 moun momentum : 2GeV x : 160cm air radiation length : 37g・cm^-2 air density : →σ = 469μm
the result of simulation 2GeV muon The cause of fixed momentum 2Gev, it can be fit with single gaussian. This simulation consistent with hand calculation.
different momentum distribution 1GeV fixed RMS: 939μm 2GeV fixed RMS: 470μm 10GeV fixed RMS: 94μm 5GeV fixed RMS: 188μm
different momentum contribution Generate muon distribution pp500GeV The second gaussian component is appeared !!!
Fit 2gaussian simulation data momentum 1〜10GeV RChiS= 1.1019
South Arm Run9 March Zero field oct 1 half 1 oct 1 half 2 oct 2 half 2 oct 2 half 1 oct 3 half 2 oct 3 half 1
A few octant have asymmetry distribution. It is not first priority to find out this asymmetry source. However, I was able to find out that source by simple correlation study. So, today I would like to talk about this study.
Run9 South March mean position direction ? 3 4 2 5 1 6 8 7
Run9 North March mean position direction ? 3 4 2 5 1 6 8 7
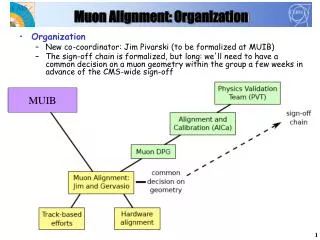
Meaning OASys It is important to align relative positions among the three stations, because it affects the momentum measurement. We align position among the three stations using field off run at the beginning of the experiment. However, each station moved 100-300 μm during the experiment period. In order to monitor this real-time movement, an optical alignment system(OASYS) has been installed into muon tracking chamber. Re-Alignment PHENIX Physics RUN Re-Alignment zero field run 1st few months few months zero field run 2nd zero field run 3rd OASysdata taking warning!! warning!! Calculation alignment system (Millepede) Optical Alignment System (OASys) The zero field run data taking is less frequent. However, OASys data taking can be 365days. It is meaningful OASYS. Making use of this advantage, OASys send the signal to taking zero field run for Millepede Alignment.
The change of Second gaussian component 上記の通り、2つのガウシアンとpol0でフィッティングを行うと3月のデータと5月のデータで第2ガウシアンのratioが変化しているように見受けられる。特に5月のデータでは、その量が総じて減っている。この理由を考察する事で今までハドロンのdecayとして扱っていた2つ目のcomponentに対して正確にIDする事が今回のstudyの目的である。 Run9 March South Oct8 half1 Rchis: 1.82 Run9 March Norh Oct3 half1 Rchis: 1.24 Run9 May Norh Oct3 half1 Rchis: 170 Run9 May South Oct8 half1 Rchis : 3.07 単純にFitが上手く決まらないのが原因で第2ガウシアンの要素が死んだと考えるもののsample。 Fitは上手くいっていて本当に第2ガウシアンのスペクトルの形が変化したのかもしれない。と思うもの。