Download
1 / 34
680 likes | 1.69k Views
Environmental Metrics & Indicators. Last Week. Business drivers Regulations / Compliance Triple Bottom Line (TBL) ISO 14000 Etc… Approaches to Reduce Environmental Impact Sustainable development Industrial ecology Pollution prevention Etc…. Today’s Goals & Objectives.

E N D
Last Week • Business drivers • Regulations / Compliance • Triple Bottom Line (TBL) • ISO 14000 • Etc… • Approaches to Reduce Environmental Impact • Sustainable development • Industrial ecology • Pollution prevention • Etc…
Today’s Goals & Objectives Learning Objectives: • Know why they are important. • Understand some basic issues regarding definitions, terminology, and characteristics . • Make you aware of some indicator classification schemes and list examples. • Understand importance to ECDM-related efforts and apply concepts. How do we define, measure, assess, and/or “predict” the environmental performance or condition of different systems?
Motivating Questions • Imagine a world without measures, metrics or any way of indicating the condition of things • How would you assess anything? • How would you improve anything? • Imagine if different companies had different or vague metrics • How would you compare or benchmark them? • How would you compare and improve their products?
Why Important?... Some reasons “You can’t manage what you can’t [or don’t] measure.” “Not everything that can be counted counts, and not everything that counts can be counted.” • Raise awareness and understanding • Measure progress towards goals • Support decision making*
One Definition • Metric – a quantitative measure or derivation from two or more measures, which may not necessarily indicate something useful to particular observers (a measure of something that does not necessarily indicate something useful) • Indicator – a characteristic that indicates a quality or state of a system (something that indicates something useful to someone based on one or more metrics, observations or both) HW
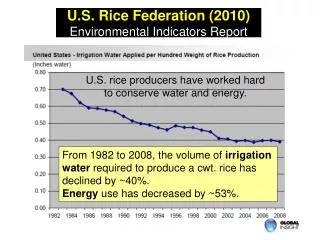
Graphical Time Trends What are the metrics and the indicators here? Graph taken from: www.nzma.org.nz/ journal/116-1175/460/
Computer Example • Issue: • Computer manufacturers are responsible for disposing of their old computers • Principle(s): • ??? • Goal(s): • ??? • Strategy: • ??? • Indicator(s): • ??? • Metric(s): • ??? • Target(s): • ???
What is or can be a “good” indicator? • Appropriate for the task • Based on readily available, accurate and verifiable data • Easy to apply and evaluate • Simple yet meaningful • Allows comparisons with other companies • Politically supported and accepted at different levels • Enhances understanding of the context of application • Has clear, transparent and standard methodology for data gathering, processing and monitoring HW
What is a “bad” indicator? • One that is not appropriate to the task • Indicators do not represent the underlying mechanics or functional relationships of the system being considered… this could lead to undesired or less than desired results if one does not understand the system well (Reap 2004) • Examples: • Office paper consumption per hour • Paper clip waste generation per month “Not everything that can be counted counts…”
Quantitative vs. Qualitative • Most people restrict the definitions of indicators to numerical (cardinal) variables • Indicators could be qualitative by being nominal or rank (ordinal) variables • Example of qualitative: • Smells • Vehicle noise and vibration • “Oiliness” of water • When are qualitative indicators preferable? • Can a quantitative indicator be “made” qualitative and vice versa? HW
Lagging vs. Leading • Lagging indicators are those that indicate what has already happened (past) • Leading indicators are those that indicate what may happen (future) • Most companies use lagging indicators • Examples of leading indicators: • Amount of soil eroded • Deforestation rate “I skate to where the puck is going to be, not where it is.” HW
Snap Shots in Space & Time Graph taken from: http://www.cbsnews.com/htdocs/dirty_air/air_quality_05.html.
Scalars vs. Vectors • A vector is a “…number of indicators presented simultaneously to give a picture of environmental conditions…” (a.k.a. an environmental profile) • A scalar is “…a single number generated by aggregation from two or more values” (a.k.a. an index) • Varying preferences • Some prefer data in simplest form possible & accept distortion introduced from simplification (scalar) • Some prefer data in most complete form possible & accept resulting complexity (vector) HW
Value Judgments in Scalars • Varying preferences • Internalize value judgments • Externalize value judgments in terms of worth or utility • Qualitative evaluations: e.g., Aesthetic values • Pretty, ok, ugly • Establishing preferences in form of weights or functions • House preference function = f(x, y), where x = cost, y = size • where w’s = numerical representation of your preference for x or y, T’s = target for x or y • Difference or ratio with respect to a standard, target, etc. • Concentration of heavy metals in wastewater vs. regulated
HW Scalar & Vector Relationship Inventory Loads Impacts Aggregated Impacts Vector Scalars
Example of Scalar Indicator • Eco-Indicator 99 developed by PréConsultants • More info: http://www.pre.nl/eco-indicator99/default.htm.
Different Classifications • Media Approach • Goal Approach • Sector Approach • Ad hoc Nomenclatures or Listings • Lowell Center for Sustainable Production (LCSP) Indicator Framework • International Standard Organization (ISO) 14031 • Global Reporting Initiative (GRI) • Facility Reporting Project (FRP) • At least 23 groups working on environmental performance measurements (Ranganathan 1998)
LCSP Indicator Framework Lowell Center for Sustainable Production HW Figure taken from (Veleva & Ellenbecker 2001).
LCSP Indicator Framework Definitions & Examples • Level One Indicators – measure a facility’s level of compliance with regulations and/or it’s conformance with industry/association standards (e.g., # of OSHA citations, # of recordable injuries, cost of environmental liabilities) • Level Two Indicators – measure the facility’s inputs, outputs and performance (e.g., amount hazardous waste, total EHS operating costs, # of employees receiving EHS training, # of community outreach activities) • Level Three Indicators – measure the potential impact that the facility’s presence and activities have on it’s workers, the surrounding environment and communities (e.g., eutrophication, disturbance of local environments) • Level Four Indicators – measure the lifecycle stages effects of their actions, which imply applying the Level 1-3 indicators throughout the supply chain (e.g., % suppliers from local area and receiving EHS training, % suppliers supporting take-back policies and without EHS violations) • Level Five Indicators – measure how a facility’s production activities affect the larger picture of sustainable society (e.g., % renewable materials used at a rate lower or equal to the renewal rate, community quality of life, worker health status compared to other companies in industry)
HW ISO 14031 Indicator Framework • Environmental Performance Indicators (EPIs) • Operational Performance Indicators (OPIs) • Management Performance Indicators (MPIs) • Environmental Condition Indicators (ECIs) Modified from (ISO_14031 1999).
Examples of ISO 14031 Indicators Taken from source: http://www.altech-group.com/ftp/EPEarticle.pdf.
HW Sample Indicators from GRI • Economic, Environmental, Social • Core, Additional • Latest GRI draft can be found at http://www.grig3.org/pdf/EN.pdf. For more info: http://www.globalreporting.org/guidelines/2002/dannex5.asp.
Example of widely used indicators A survey by the Global Environmental Management Initiative (GEMI) in 1995 revealed the following top measures by various companies (GEMI 1998)
How do you choose indicators? • Figure out the issue, principle, goal and strategy the indicator addresses • What is the purpose? • External or internal environmental reporting • Product or process redesign • Corporate or government policy making • Is it currently an important metric to your company, industry sector, local community, nation, world? • Is it suggested and accepted by different researchers and non-government organizations? • Is it an input to a more detailed and meaningful environmental assessment model? • Is it hazardous or non-hazardous? Regulated or not? • Is it a “big hitter”? (20/80 rule) HW
EPA’s Approach • EPA’s Environmental Indicator Initiative has developed different documents on evaluating the utility of certain indicators for environmental management and national contexts • Various documents: http://www.epa.gov/indicators/keydocs.htm. • Indicator quality review format: http://www.epa.gov/indicators/docs/QualityReviewFormat.pdf. *They may be helpful in thinking through some other aspects of developing and evaluating the utility of indicators. HW
Homework • Due date: February 14th, 2006 • Expected format: MS Word Document • File name convention: ME4171.I&M.HW.your last name • Contact Info: • E-mail: felipe.roman@gatech.edu • Hours: M-W, F 10:00 am – 5:00 pm • Office: Management Building, Tech Square, Suite 400 • Phone: 404-385-4955
Summary Main Points • Indicators are important to support decision making • Different definitions of indicators & metrics abound… here you have some and a relationship diagram to help you select or develop relevant indicators to particular issues • Indicators can be qualitative, vectors, scalars, leading, which can useful in different situations • Many indicator classifications, frameworks, and lists are out there – you should use them when working with indicators • Choosing the good indicators may not be obvious at times – choose carefully since these will guide many of your measurement/data gathering efforts
References • Gallopin, G., 1997, "Indicators and their use: information for decision-making," in Sustainability Indicators: Report of the Project on Indicators of Sustainable Development, B. Moldan and S. Billharz, John Wiley and Sons Ltd, URL: http://www.icsu-scope.org/downloadpubs/scope58/ch01-introd.html. • Veleva, V. and Ellenbecker, M., 2001, "Indicators of sustainable production: framework and methodology," Journal of Cleaner Production, 9: pp. 519-549. • Ranganathan, J., 1998, "Sustainability Rulers: Measuring Corporate Environmental & Social Performance," World Resource Institute, pp. 1-11. • FRP, 2005, Facility Reporting Project Guidelines, http://www.facilityreporting.org/FRPPilotDraft.htm. • GEMI, 1998, ENVIRONMENTAL PERFORMANCE: A Primer and Survey of Metrics In Use, URL: http://www.gemi.org/MET_101.pdf. • ISO_14031, 1999, "Environmental management - Environmental performance evaluation - Guidelines," International Standard Organization (ISO), pp. 32. • Roman, F., and B. Bras, 2005, Environmental Decision Support for Manufacturing Technology Selection, ME8903: Special Problems in Manufacturing Final Report, George W. Woodruff School of Mechanical Engineering. • Reap, J., 2004, Plants in the Garden: An Approach to Modeling the Impact of Industrial Activities in Ecosystems, Mechanical Engineering M.S. Thesis, Georgia Institute of Technology.
Useful Websites & Documents • The Sustainability Report – Measuring Sustainability http://www.sustreport.org/indicators/index.html. • National Academy of Engineering (NAE), 1999, Industrial Environmental Performance Metrics: Challenges and Opportunities, Washington, D.C., National Academy Press, p. 264, Executive Summary URL: http://books.nap.edu/html/ind_env_perf_met/. • NAE, 1998, International Conference on Industrial Environmental Performance Metrics, Held at The Arnold and Mabel Beckman Center of the National Academies, Irvine, California, November 2-4, 1998, Prepared by Deanna J. Richards, Long Nguyen, http://www.nae.edu/pdf/IntlConfSumm.pdf. • World Business Council for Sustainable Development (WBCSD), 2000, Measuring Eco-Efficiency: A guide to reporting company performance, URL: http://www.wbcsd.org/Plugins/DocSearch/details.asp?DocTypeId=25&ObjectId=Mjgy&URLBack=%2Ftemplates%2FTemplateWBCSD2%2Flayout%2Easp%3Ftype%3Dp%26MenuId%3DMjMz%26doOpen%3D1%26ClickMenu%3DLeftMenu. • EU Sustainable Development Online, URL: http://sd-online.ewindows.eu.org/. • CERES website, http://www.ceres.org/. • Facility Reporting Project (FRP), http://www.facilityreporting.org/. • Emblemsvåg, J. and Bras, B., 2001, Activity-Based Cost and Environmental Management - A Different Approach to the ISO 14000 Compliance, Chapter 2, Section 5, Kluwer Academic Publishers.