Download
1 / 1
10 likes | 126 Views
38. 38. 36. 36. 34. 34. 32. 32. Underwater Sensors. ENSO February 1998 SSH anomaly. INDO-PAC. China. Networks Workshop. India. 30 ° N. 0 °. 30 ° S. Australia. 150 ° W. 60 ° E. 110 ° E. 160 ° E. 100 ° W. -4. -2. 0. 2. 4. cm. Ocean Modeling.

E N D
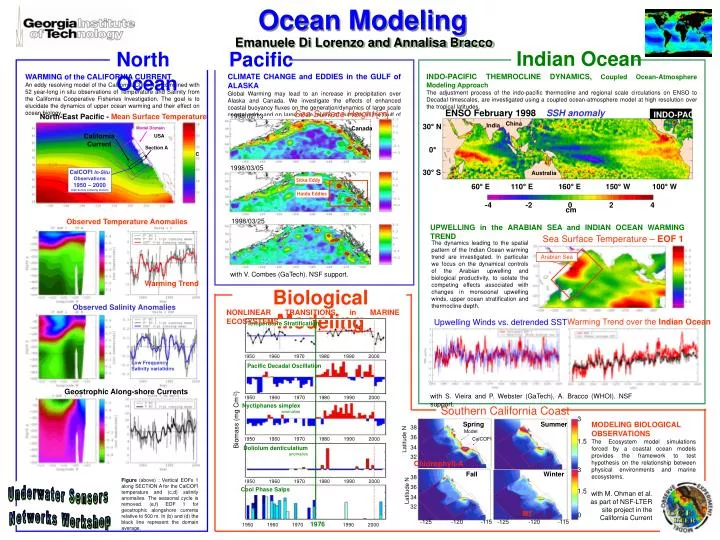
38 38 36 36 34 34 32 32 Underwater Sensors ENSO February 1998 SSH anomaly INDO-PAC China Networks Workshop India 30° N 0° 30° S Australia 150° W 60° E 110° E 160° E 100° W -4 -2 0 2 4 cm Ocean Modeling Emanuele Di Lorenzo and Annalisa Bracco Indian Ocean North Pacific Ocean INDO-PACIFIC THEMROCLINE DYNAMICS, Coupled Ocean-Atmosphere Modeling Approach The adjustment process of the indo-pacific thermocline and regional scale circulations on ENSO to Decadal timescales, are investigated using a coupled ocean-atmosphere model at high resolution over the tropical latitudes. CLIMATE CHANGE and EDDIES in the GULF of ALASKA Global Warming may lead to an increase in precipitation over Alaska and Canada. We investigate the effects of enhanced coastal buoyancy fluxes on the generation/dynamics of large scale coastal eddy and on large scale mixing of nutrients in the Gulf of Alaska. WARMING of the CALIFORNIA CURRENT An eddy resolving model of the California Current is combined with 52 year-long in situ observations of Temperature and Salinity from the California Cooperative Fisheries Investigation. The goal is to elucidate the dynamics of upper ocean warming and their effect on ocean biology. Sea Surface Height [m] North-East Pacific - Mean Surface Temperature 1998/02/13 Canada Model Domain m California Current USA Section A C 1998/03/05 CalCOFIIn-Situ Observations 1950 – 2000 (high density sampling domain) Sitka Eddy Haida Eddies Observed Temperature Anomalies 1998/03/25 UPWELLING in the ARABIAN SEA and INDIAN OCEAN WARMING TREND Sea Surface Temperature – EOF 1 The dynamics leading to the spatial pattern of the Indian Ocean warming trend are investigated. In particular we focus on the dynamical controls of the Arabian upwelling and biological productivity, to isolate the competing effects associated with changes in monsoonal upwelling winds, upper ocean stratification and thermocline depth. Arabian Sea with V. Combes (GaTech). NSF support. Warming Trend Biological Modeling Observed Salinity Anomalies NONLINEAR TRANSITIONS in MARINE ECOSYSTEMS Warming Trend over the Indian Ocean Upwelling Winds vs. detrended SST Temperature Stratification 1950 1960 1970 1980 1990 2000 Low Frequency Salinity variations Pacific Decadal Oscillation Geostrophic Along-shore Currents with S. Vieira and P. Webster (GaTech), A. Bracco (WHOI). NSF support. 1950 1960 1970 1980 1990 2000 Nyctiphanes simplex anomalies Southern California Coast 3 0 Biomass (mg Cm-2) MODELING BIOLOGICAL OBSERVATIONS The Ecosystem model simulations forced by a coastal ocean models provides the framework to test hypothesis on the relationship between physical environments and marine ecosystems. Spring Summer Model 1950 1960 1970 1980 1990 2000 CalCOFI Latitude N 1.5 Doliolum denticulatium anomalies Chlorophyll-A 3 Fall Winter Figure (above) : Vertical EOFs 1 along SECTION A for the CalCOFI temperature and (c,d) salinity anomalies. The seasonal cycle is removed. (e,f) EOF 1 for geostrophic alongshore currents relative to 500 m. In (b) and (d) the black line represent the domain average. 1950 1960 1970 1980 1990 2000 Cool Phase Salps 1.5 Latitude N with M. Ohman et al. as part of NSF-LTER site project in the California Current M1 -125 -120 -115 -125 -120 -115 1950 1960 1970 1976 1990 2000